A revenue KPI arrives at the quarterly review in red. Plan was indexed at 100; actual is 92. Within minutes the room can usually produce four explanations for the eight-point miss: weaker demand, pricing, mix, or currency.
There is no reason to choose among them yet. At this point the only established fact is that one measured result differs from one reference value.
A useful variance review has to earn its explanation. The work starts by checking whether the comparison is sound, then reconstructing the movement, narrowing its location, and setting competing explanations against observations that could prove inconvenient.
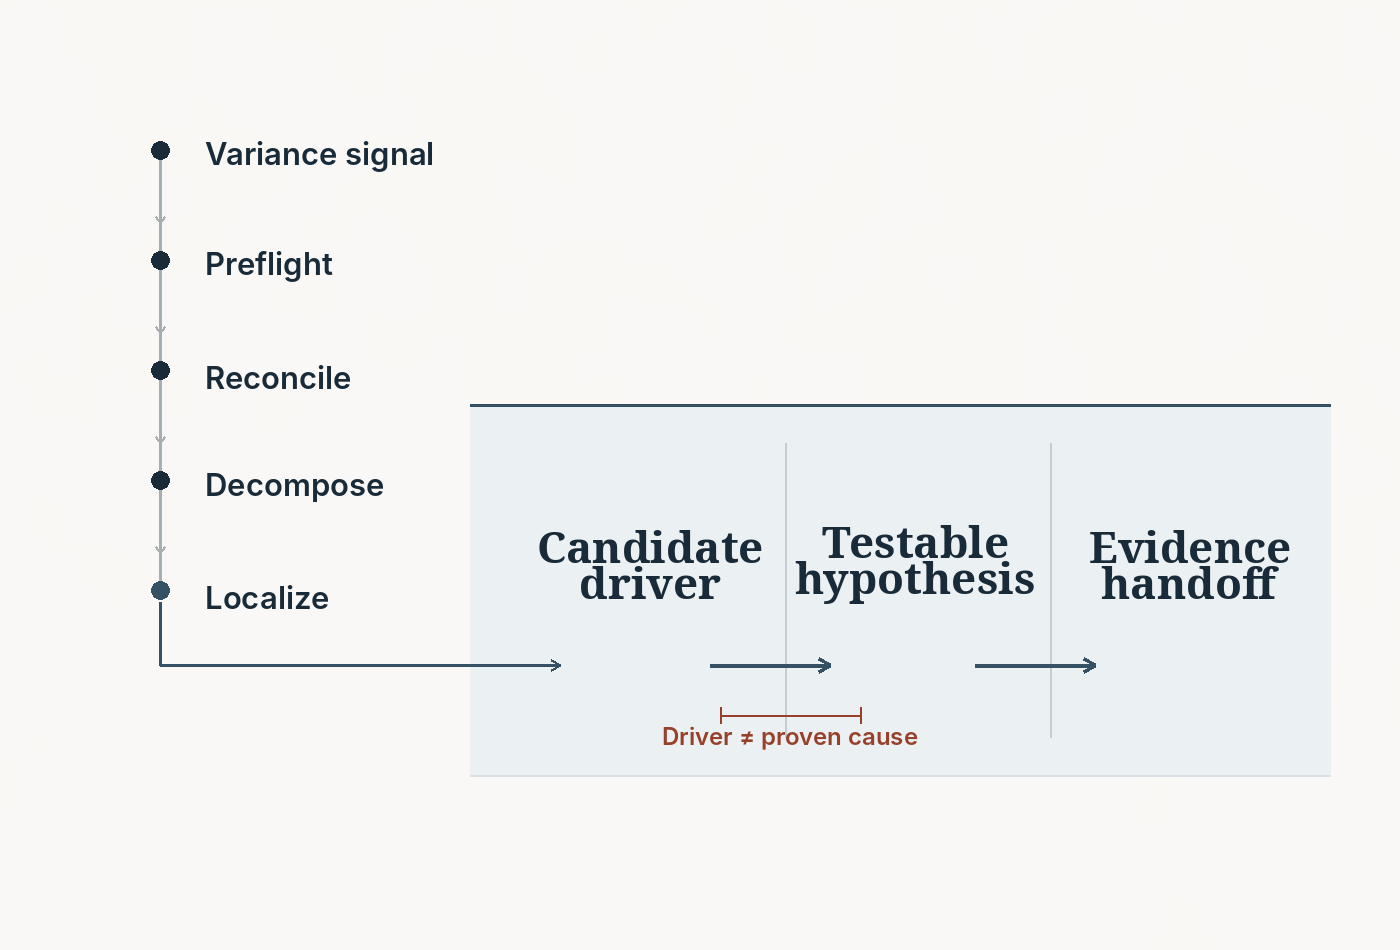
The eight-point miss may not mean what it appears to mean
Start with the measurement contract. A metric labelled Revenue can change when reporting scope, currency treatment, fiscal calendar, organisational mapping or late data change. Conversion can move because somebody changed the funnel entry point or an exclusion rule. Before treating an apparent miss as operating performance, those definitions need to be stable.
Activity matters as well. AFP’s budgeting guidance describes variance analysis as the identification and analysis of differences between planned and actual results, and discusses flexible budgets where expectations should move with actual activity. If a business expected to ship 100,000 units but shipped 80,000, some variable costs should fall with volume. Comparing those costs with the untouched static budget can mix a volume change with an execution problem.
Only then is it worth asking which reference is being used. Budget, latest forecast, prior period and management target each create a legitimate variance, but they answer different questions. A miss against the annual budget can coexist with performance ahead of the latest forecast. Calling both simply “plan” hides that distinction.
For the 100-to-92 example, the preflight therefore covers metric definition, comparator, scope, period, currency and data integrity. If one of those has changed materially, diagnosis stops there until the comparison is repaired.
Reconstruct the movement before assigning a mechanism
Once 100 and 92 are genuinely comparable, the next task is arithmetic. The components between them should add back to the observed -8.
Price-Volume-Mix analysis is one common way to examine sales or earnings movement, and AFP materials use price, volume and mix for that purpose. The interaction between price and volume, however, does not have one universal allocation convention. It may be assigned to one component, split, or retained as an interaction or residual. An analyst therefore needs to state the convention and make the bridge close rather than present one formula as canonical.
Coca-Cola’s FY2025 results show why this separation is useful. Reported net revenues grew 2%, while organic revenues grew 5%. The company’s disclosed organic bridge included roughly 4% price/mix and 1% concentrate sales. Currency was about a 2% headwind, and acquisitions/divestitures about a 1% headwind.
Those figures turn a 2% headline into several distinct movements. They still do not establish why consumers behaved as they did. Coca-Cola noted in its Q4 discussion that concentrate-sales movement can differ from unit case volume partly because of shipment timing. The bridge is doing its job when it reconciles reported movement; it becomes misleading only when a component is silently promoted into a causal conclusion.
Narrow the search space, then organise the candidate drivers
Suppose our illustrative bridge puts most of the eight-point shortfall in transaction volume. That is useful, but “volume” is still much too broad for an operating team.
A product cut may put the miss in Product B. Geography may point to APAC. Channel analysis may show that self-serve is weak while sales-assisted traffic is stable. Cohorts can separate new from returning behaviour; a funnel cut can distinguish traffic from conversion and checkout completion. These views do not need to compete for the title of “correct decomposition”. Their practical value is that several cuts can converge on a much smaller area to investigate.
Assume they converge on APAC self-serve, with checkout conversion down. A driver structure can now organise what to inspect. For a simplified transaction business:
Revenue ≈ Active Customers × Transactions per Customer × Revenue per Transaction
and, within one channel:
Transactions ≈ Qualified Traffic × Conversion Rate
Checkout conversion is now a sensible candidate driver of lower transactions. It is not yet an explanation of why conversion moved. Poorer traffic quality, product friction, payment failure, pricing, promotional changes or a tracking-definition change could all sit underneath the same observed driver.
That distinction is what keeps a driver tree useful. It prioritises the investigation without pretending that its arrows have already demonstrated causality.
Make the explanations produce different predictions
At APAC self-serve checkout, two working hypotheses might deserve attention.
One is a traffic-mix explanation: newer paid acquisition is bringing lower-intent visitors. If so, the conversion decline should be concentrated in newer paid cohorts; direct and returning traffic should be comparatively stable; and checkout technical success should not show a new breakpoint. A broad decline across direct, organic, paid and returning users at the same time would weaken this account.
The other is checkout friction introduced by a product release or payment-path change. That hypothesis predicts a break after the relevant release, with drop-off concentrated in the affected device, version or payment step while unaffected paths remain more stable. If no release breakpoint exists and versions, devices and payment paths fall together, the hypothesis loses priority.
This is managerial hypothesis testing, not a formal H0/H1 statistics exercise. The useful discipline is that each explanation commits itself to observations that should exist if it is right, plus observations that would count against it. McKinsey’s hypothesis-driven operations work makes the same practical point: assumptions should be validated or disproved with evidence rather than protected after the fact.
An explanation such as “the market may be weak, but markets are complicated” makes no risky prediction. Nothing can count against it, so it does little to focus the work.
Hand over the state of the diagnosis, not just its favourite story
A review can stop before root cause is established and still be decision-ready. The handoff needs to distinguish what is observed, what has been reconciled, what has been localised, which candidate drivers matter, which hypotheses are still alive, and what evidence comes next.
For the illustrative case, that might be summarised as follows:
Revenue moved from a plan index of 100 to an actual 92. The comparator and metric definition are stable. The bridge places most of the gap in transaction volume, and several cuts localise the movement to APAC self-serve. Checkout conversion is the leading candidate driver. The two priority hypotheses are weaker traffic mix and new checkout friction. Source-cohort conversion and release/payment-path breakpoints are the next tests; neither hypothesis is being called a root cause yet.
That statement gives an operator enough to decide whether to act, investigate further, or escalate into deeper causal or RCA work. It also makes uncertainty visible rather than hiding it inside a confident sentence.
The most useful final check is simple: what observation would make the leading explanation lose? If the review cannot answer that, it has probably produced commentary. If it can, the variance has become something the organisation can actually investigate.
References
- Association for Financial Professionals, Budgeting.
- Association for Financial Professionals, FPAC Test Specifications.
- Association for Financial Professionals, Our Favorite Financial Analyses, 7 May 2024.
- McKinsey & Company, How to master the seven-step problem-solving process, 13 September 2019.
- McKinsey & Company, How good are your internal operations, really?, 18 February 2022.
- The Coca-Cola Company, FY2025 / Q4 2025 results release, 10 February 2026.