Consider a service incident that has been “fixed” several times. A certain class of configuration change sometimes brings the service down under heavy traffic. Rollback usually restores service, yet most deployments are harmless. Monitoring can be late, and the review process does not reliably stop the risky cases.
Four analysts could examine that incident without sharing the same representation of it. A 5 Whys investigation follows one causal chain towards the conditions that allowed the configuration into production. Fishbone opens a wider candidate-cause space. FTA starts from a defined top event and models combinations. A system-safety analysis follows constraints, control actions and feedback through the wider control structure.
Those are different analytical objects, not four drawing styles. Once a representation is chosen, some relationships become easy to inspect and others fall outside the frame. That decision happens before anyone writes down “the root cause”.
Method choice begins with the structure you need to represent
For this article, the working sequence is Problem shape → Representation → Method → Escalation. It is an editorial synthesis of documented method uses and limits, not a standards-body taxonomy or a ladder from elementary to sophisticated.
The same service incident can plausibly be modelled as a local chain, a field of candidates, a combination of conditions or a control problem. Elsewhere, the harder part may be a contested problem definition or feedback with delay. The useful representation is the one that keeps the relationships needed for the decision visible. A bounded local mechanism may need nothing heavier than 5 Whys; a multi-layer control problem can lose information when forced into a linear chain.
5 Whys and Fishbone start from different kinds of uncertainty
5 Whys follows a mechanism you can already see
Toyota has long associated repeated “why” questioning with kaizen and problem solving. The technique does not require mystical loyalty to the number five; its practical discipline is to move past the first visible symptom. Toyota’s 2014 annual report and the Lean Enterprise Institute’s explanation support that bounded reading.
For the service incident, one line of enquiry could be:
Why did the service fail? A configuration behaved badly under high load.
Why could it reach production? Validation did not cover the relevant state.
Why did validation miss it? The change checks exercised ordinary traffic conditions only.
Why was high load absent from the checks? The test and change criteria did not encode it as a necessary operating constraint.
The chain has moved the team from an outage symptom to a changeable mechanism in testing and release design. It has not examined every branch. Delayed monitoring, a capacity edge, a third-party dependency or a hand-off problem could still matter, so 5 Whys is most useful when a plausible local mechanism is already observable and depth is the missing piece.
Fishbone widens the search before committing to a path
ASQ describes the Fishbone Diagram, also called an Ishikawa or cause-and-effect diagram, as a way to identify many possible causes, organise them into categories and support structured brainstorming. The same incident might be spread across People (reviewer experience, hand-offs, ownership), Process (change workflow, test conditions, rollback criteria), Technology (configuration validation, monitoring, capacity limits) and Environment (traffic profile, dependent services, deployment timing). The diagram broadens the search; its branches are still candidate causes, not verified causal facts or an automatic priority ranking.
| Investigation need | 5 Whys | Fishbone |
|---|---|---|
| Primary move | Follow one local chain in depth | Expand the candidate-cause space |
| Sensible starting point | A plausible mechanism is already observable | The cause space is still too narrow |
| Typical misuse | Treat the first chain as the only explanation | Treat brainstormed candidates as verified causes |
| Sign that the representation is running out | Branches and interactions dominate the chain | Candidates need AND/OR logic or dynamic relationships |
When the outcome requires several conditions to occur together, both representations start to run out of room.
FTA makes combinations part of the model
Fault Tree Analysis starts from a defined top event and works downwards through the events or conditions that can produce it. NASA’s Fault Tree Handbook with Aerospace Applications describes FTA as a top-down failure-analysis technique, commonly using AND and OR logic to make combination relationships explicit.
Take the top event “After a configuration change, the service becomes unavailable under peak traffic.” A deliberately small fragment might require both A: a risky configuration reaches production AND B: the system enters the load region that triggers the defect. A could follow from failed validation OR a review that misses the risk; B could be an ordinary demand peak OR extra pressure caused by upstream retries.
A Fishbone can put configuration, load and review on the page. FTA requires a stronger commitment about how they relate: alternatives, jointly necessary conditions, or neither. That clarity depends on a defined top event and scope. If the dominant relationships are management decisions, control signals, delayed feedback or interactions across organisational layers, adding branches to an event-logic tree does not necessarily make the model more faithful.
STPA and CAST move the analysis into the control structure
MIT’s Partnership for Systems Approaches to Safety and Security publishes the STPA and CAST handbooks and related systems-theoretic safety material. Here the investigation is no longer limited to a chain of component failures. It also examines the control structure, constraints, control actions and feedback used to keep the system within safe boundaries.
For the service incident, that means asking which safety constraint should have stopped the configuration from being active under that load, who or what was meant to enforce it, whether the controller received timely feedback, and whether management processes allowed a meaningful risk signal to disappear before the decision. Validation may exist without seeing the true production load state. A reviewer may receive an incomplete risk signal. Monitoring may detect the error only after useful control action is too late. Components can individually behave as designed while their interaction still creates an unsafe state.
STPA is principally a proactive hazard-analysis method. CAST is the more direct post-incident or post-accident counterpart, examining how the control structure made the outcome possible.
A bounded, reproducible local defect does not automatically justify a systems-theoretic model. The extra modelling effort earns its keep when safety, control, organisation and interaction are themselves part of what must be explained.
An RCA can close while the recurrence risk remains open
A 2020 systematic review of RCA in patient safety found that RCA could identify contributing factors, while evidence that resulting actions consistently produced measurable patient-safety improvements was limited and heterogeneous. That finding belongs to healthcare and patient safety; it does not establish that RCA is ineffective in software, manufacturing, finance or every other field.
What it does support is a narrower caution about analytical closure. A completed report and a coherent causal story are not, by themselves, evidence that recurrence has been prevented. Representation mismatch may already be visible when a 5 Whys chain keeps splitting, Fishbone candidates turn out to depend on one another, or an FTA captures events but not the important control and feedback relationships.
Disagreement about the problem boundary or definition of success is a different kind of warning. So is behaviour driven by feedback and delay. In those cases the team may need to structure the problem itself before asking for one root cause.
Wicked problems require work on the problem definition itself
“Our AI adoption has failed. Find the root cause.” Executives may mean low adoption. Front-line staff may mean slower workflows. Legal may mean data and accountability risk. Engineering may mean model quality and integration problems. Finance may mean rising cost without a visible productivity return. Beginning with “Why is adoption low?” would silently select one stakeholder’s definition.
Rittel and Webber’s 1973 paper describes wicked planning problems without the definitive formulation, clear stopping rule or objective final solution associated with well-structured technical problems. “Wicked” does not mean impossible to improve. It means that problem understanding and intervention affect one another, and stakeholders may judge outcomes through different values.
SSM works on the problem situation
Checkland’s retrospective on Soft Systems Methodology places SSM in complex human problem situations. For the AI-adoption case, SSM can bring questions about adoption, task performance, risk-adjusted value, specific workflows, authority to define success, and technical versus policy or incentive constraints into the same problem situation. It is not an FTA-style algorithm for proving a failure logic.
PSMs allow the method to change as the problem becomes clearer
Mingers and Rosenhead’s review of Problem Structuring Methods examines messy and complex situations, including method selection and combination. A team can use SSM while boundaries are contested and later apply a harder analytical method to a subproblem whose objective and scope have stabilised.
Cognitive maps surface construed causal relationships
Eden’s work on cognitive maps uses them to help structure messy issues by making an individual or group’s construed relationships visible. A team might write Unstable AI quality → lower trust → lower use → less real-world feedback → slower product improvement. That makes assumptions inspectable; it does not verify the arrows. A cognitive map records perceived causal relations, not empirically established causation, and it is not interchangeable with a Causal Loop Diagram merely because both use boxes and arrows.
Feedback and delay call for a different diagram
System dynamics uses Causal Loop Diagrams (CLDs) to represent feedback structure. John Sterman’s Business Dynamics material emphasises causal links, polarity, feedback, delay and the need to distinguish causation from correlation.
For AI adoption, a hypothetical reinforcing loop could be Actual use ↑ → practical experience ↑ → high-quality feedback ↑ → tool improvement ↑ → perceived usefulness ↑ → actual use ↑. Low initial use can push the same relationships in an undesirable direction. A separate loop, Deployment pressure ↑ → learning burden ↑ → short-term productivity pressure ↑ → resistance ↑ → use ↓, captures a different mechanism. Productivity benefits from learning or tool improvement may also arrive after a delay, so judging the programme after week one or two can mistake a delayed dynamic for a one-way failure.
The arrows remain hypotheses. Decision-relevant links still need evidence; a diagram does not promote correlation into causation. If feedback and delay are not material to the question, the CLD may add complexity without adding explanatory value.
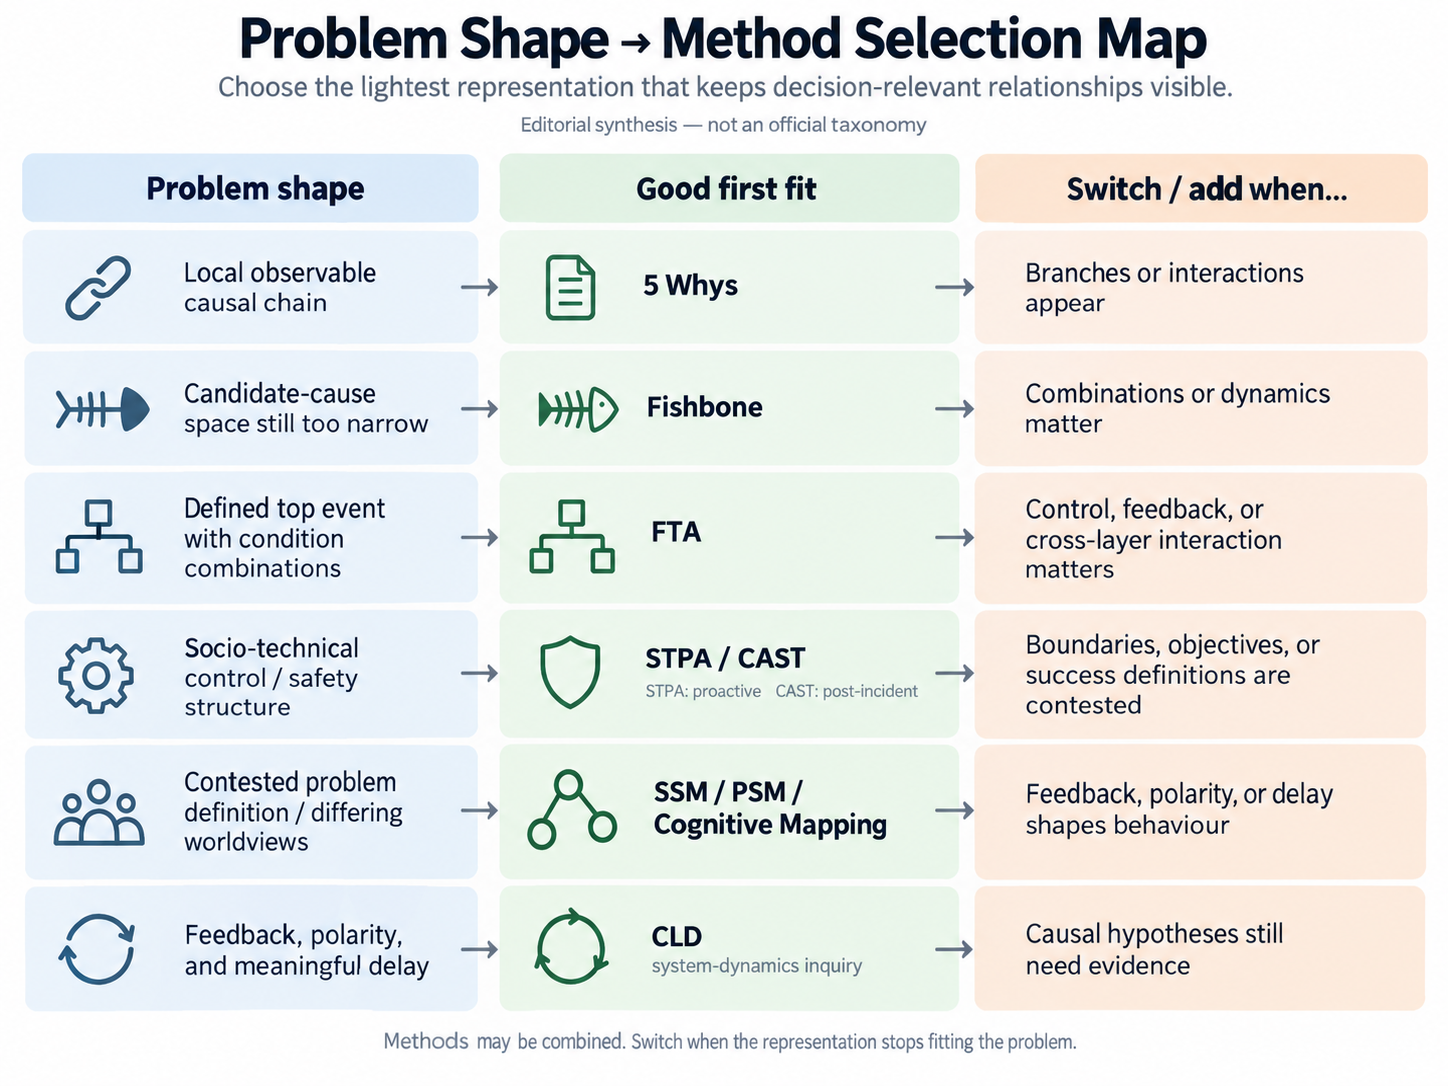
Choose the lightest adequate representation, then watch for mismatch
| Shape currently visible | Representation / method to consider first | Signal to switch or add another method |
|---|---|---|
| A local, observable causal chain | 5 Whys | Several plausible branches or interactions appear |
| The candidate-cause space is still too narrow | Fishbone | Candidates depend on AND/OR combinations or dynamic relationships |
| A defined top event requires combinations of conditions | FTA | Control, feedback and cross-layer interaction matter more than event logic |
| Safety or risk emerges from a socio-technical control structure | STPA; CAST for post-incident analysis | The problem boundary, objective or success definition is also contested |
| Stakeholders hold different worldviews about the problem and goal | SSM / PSM; cognitive mapping | Behaviour is substantially shaped by feedback, polarity and delay |
| Reinforcing/balancing loops and meaningful delays shape behaviour | CLD / system-dynamics inquiry | Key causal hypotheses need to be tested with evidence |
This is a practical selection aid, not a universal standard or a mutually exclusive decision tree. Methods can be combined: Fishbone can open the search space before 5 Whys follows a supported local mechanism; FTA can express failure logic before STPA examines control relationships it represents poorly; SSM or cognitive mapping can organise disagreement before a stable subproblem is analysed more narrowly.
Use the lightest representation that answers the question. Change it when preserving the model requires you to flatten several branches into one line, squeeze an interaction into one event, discard a stakeholder worldview as noise or draw feedback as a one-way arrow. In those cases, tidying the diagram is not the priority. Keeping the relevant causal structure visible is.
References
- Toyota Motor Corporation, Annual Report 2014, “What Sets Toyota Apart”: https://www.annualreports.com/HostedData/AnnualReportArchive/t/NYSE_TM_2014.pdf
- Lean Enterprise Institute, “Clarifying the ‘5 Whys’ Problem-Solving Method”: https://www.lean.org/the-lean-post/articles/five-whys-animation/
- ASQ, “What is a Fishbone Diagram?”: https://asq.org/quality-resources/fishbone
- NASA, Fault Tree Handbook with Aerospace Applications: https://extapps.ksc.nasa.gov/reliability/Documents/Fault_Tree_Handbook_with_Aerospace_Applications_August_2002.pdf
- MIT PSASS, STPA / CAST books and handbooks: https://psas.scripts.mit.edu/home/books-and-handbooks/
- Rittel, H. W. J. & Webber, M. M., “Dilemmas in a General Theory of Planning”: https://doi.org/10.1007/BF01405730
- Checkland, P., “Soft Systems Methodology: A Thirty Year Retrospective”: https://doi.org/10.1002/1099-1743(200011)17:1+%3C::AID-SRES374%3E3.0.CO;2-O
- Mingers, J. & Rosenhead, J., “Problem Structuring Methods in Action”: https://doi.org/10.1016/S0377-2217(03)00056-0
- Eden, C., “Analyzing cognitive maps to help structure issues or problems”: https://doi.org/10.1016/S0377-2217(03)00431-4
- Sterman, J. D., Business Dynamics: https://mitmgmtfaculty.mit.edu/jsterman/business-dynamics/
- Martin-Delgado, J. et al., “How Much of Root Cause Analysis Translates into Improved Patient Safety: A Systematic Review”: https://doi.org/10.1159/000508677