假設一家公司有兩個客戶 A 和 B。兩邊 Revenue 都是 100,000,COGS 都是 40,000,Gross Profit 因此同樣是 60,000。只看這一層,兩個客戶沒有差別。
營運資料卻很快把差距拉開。B 要花更多 onboarding 時間,客服時數高得多,例外處理與客製報表也更重。當問題從「毛利多少」變成「要不要漲價、改服務內容、續約或退出」,原本那個 60,000 仍然是重要資訊,只是已經回答不了整個決策。
這篇會沿著同一個案例,把 reported gross margin、Cost-to-Serve、fully allocated profit、avoidable / incremental decision cost 分開看。重點不在選出唯一正確的成本,而在於先知道每個數字是拿來回答哪一種問題。
先把決策說清楚,再選成本視角
同一筆業務,可以同時存在四個合理的成本視角:
| Cost lens | 它主要回答什麼? | 最容易被誤用成什麼? |
|---|---|---|
| Gross Margin | 扣掉公司定義的 COGS / Cost of Revenue 後,還剩多少? | 把毛利直接當成客戶或產品的完整獲利能力 |
| Cost-to-Serve | 這個客戶、通路、產品或服務層級實際消耗了哪些活動與資源? | 把所有 assigned cost 都當成可立即省下的現金 |
| Fully Allocated Profit | 加上 shared services / corporate allocation 後,這個 cost object 分到多少完整成本? | 看到負數就直接判定應退出 |
| Avoidable / Incremental Economics | 如果採取指定行動,在指定時間內,哪些收入、成本、容量與現金流真的會變? | 忽略長期容量與機會成本,只看短期現金 |
IMA 的 managerial costing 指引把管理決策與財務報導的成本模型分開處理。管理者需要的是能對應決策目的與資源消耗因果的成本資訊;某筆成本已經被分攤到一個對象,並不會因此自動變成可避免成本。IMA: Developing an Effective Managerial Costing Model
因此,報表呈現、客戶服務負擔、定價、90 天 keep/drop,以及長期 capacity planning,可以共用底層資料,卻未必共用同一個成本邊界。先講清楚要做哪個決策,後面的數字才有意義。
Gross Margin 打平後,Cost-to-Serve 才把工作量翻出來
回到 A 和 B。Direct Cost 與 Indirect Cost 要看你正在分析哪個 Cost Object。一筆資源對產品線可能可以直接追蹤,換成單一客戶時,卻可能需要透過 activity 或 driver 才能分配。IMA: Conceptual Framework for Managerial Costing
ABC,也就是 Activity-Based Costing,可以把關係寫成:
resources → activities → cost objects
先指定客戶、產品、通路、服務方案或流程,再看它消耗了哪些活動。以下數字只是教學案例,不是任何公司的實際資料。
| Activity | Rate | Customer A | A cost | Customer B | B cost |
|---|---|---|---|---|---|
| Implementation / onboarding | 100 / hour | 40 h | 4,000 | 120 h | 12,000 |
| Support | 50 / hour | 80 h | 4,000 | 240 h | 12,000 |
| Exception handling | 80 / case | 20 | 1,600 | 75 | 6,000 |
| Custom reporting / operations | 100 / hour | 20 h | 2,000 | 50 h | 5,000 |
| Cost-to-Serve | 11,600 | 35,000 |
兩個客戶原本都是 60,000 Gross Profit。把服務活動放進來後,A 剩 48,400,B 剩 25,000:
- A:60,000 − 11,600 = 48,400
- B:60,000 − 35,000 = 25,000
這類差異在真實業務裡很常見。雲端成本可能同時受 compute、tier、egress 與 step pricing 影響;支付業務會碰到交易筆數、付款方式、跨境、退款與 dispute;通訊服務也可能有 usage-linked network 或 carrier cost。把所有負擔壓成一個平均率,很容易把服務複雜度吃掉。AWS EC2 Pricing Google Cloud Network Pricing Stripe Pricing
B 被分到 35,000 的 Cost-to-Serve,只表示它在這套模型裡消耗了這些活動與資源。公司若真的停止服務 B,能不能省下同樣的金額,還要看那些資源目前處於什麼 capacity 狀態。
TDABC 把容量用量留在模型裡
TDABC,也就是 Time-Driven Activity-Based Costing,會把 activity costing 接到容量。Kaplan 與 Anderson 的核心做法需要兩個估計:供應每單位資源容量的成本,以及每種交易或活動需要多少時間/資源。這樣就能同時看到 supplied capacity、used capacity、unused capacity,不必把全部供應成本都塞進現有 cost objects。Kaplan & Anderson, Time-Driven Activity-Based Costing
用客服團隊做例子:Practical capacity 是 2,500 hours,Period resource cost 是 125,000,所以 capacity cost rate 為 50 / hour。目前實際使用 2,250 hours,剩下 250 hours unused capacity。B 使用 240 小時 support,模型因此分配 12,000 的 support capacity cost 給 B。
若明天停止服務 B,使用量會從 2,250 小時降到 2,010 小時,unused capacity 則增加到 490 小時:
| Support capacity | Before dropping B | After dropping B |
|---|---|---|
| Practical capacity | 2,500 h | 2,500 h |
| Used capacity | 2,250 h | 2,010 h |
| Unused capacity | 250 h | 490 h |
| Period resource cost | 125,000 | 125,000 |
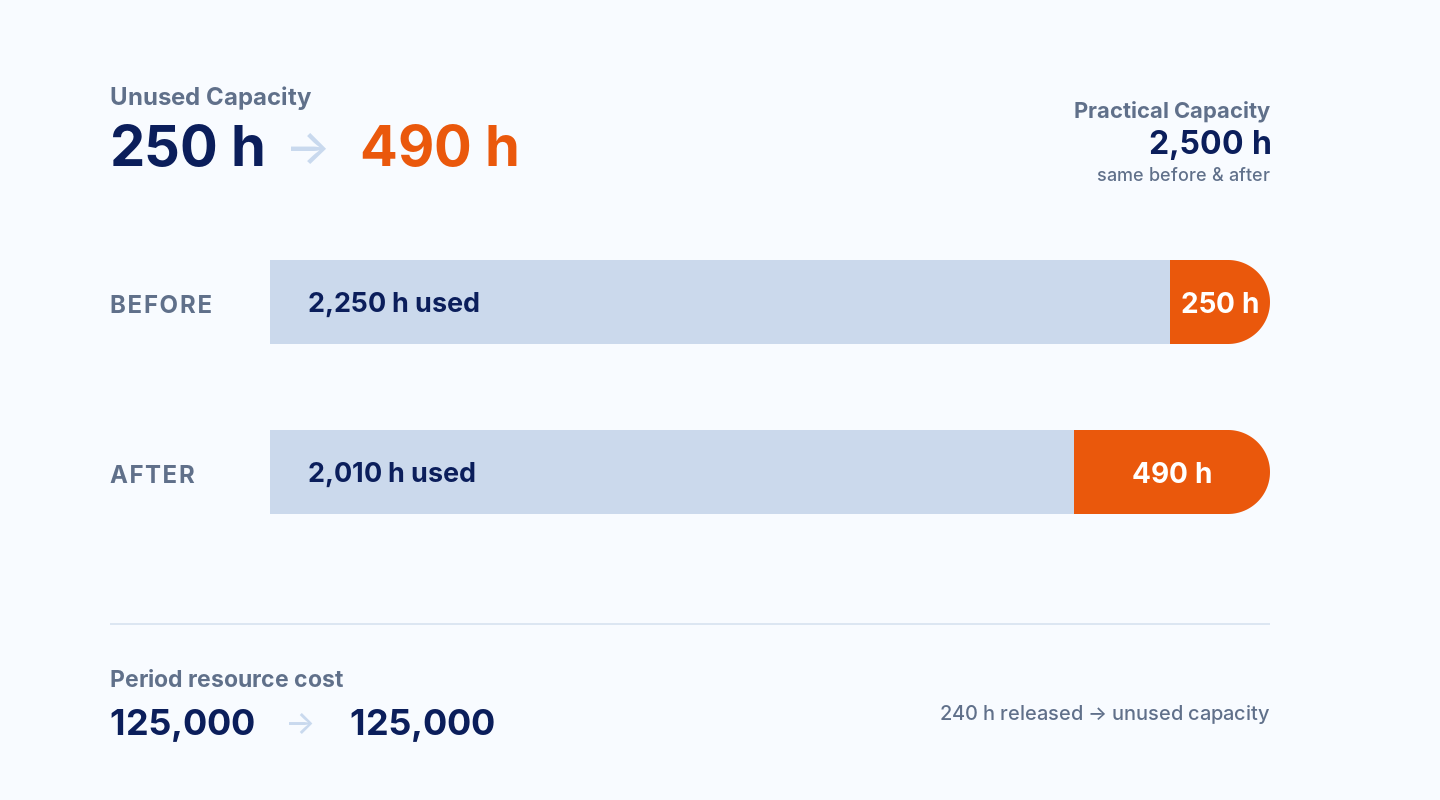
短期內若客服仍是同一批 salaried capacity,Period resource cost 依然是 125,000。那 12,000 並沒有消失,只是原本服務 B 的 240 小時變成閒置容量。這也是後面 keep/drop 最容易算錯的地方。
IAS 2 也會處理 capacity,但目的不同。它用 normal capacity 分攤固定 production overhead,避免低產量或 idle plant 把每單位固定製造費用推高。那是 inventory costing 與外部報導的規則,不是 customer Cost-to-Serve 的管理用 denominator。IAS 2 Inventories
有閒置容量,和真的卡在 bottleneck,是兩件事
Support 若還有 unused capacity,多服務一個客戶,短期內未必需要增加固定薪資。Implementation / onboarding 如果已經滿載,情況就不同:新的需求會排擠其他工作,這時才需要把 opportunity cost 算進來。
在只有一個 binding constraint 的情境,可以比較每單位 constrained resource 能創造多少 contribution。OpenStax 對單一稀缺資源的決策也是用這個邏輯排序。OpenStax: Decisions When Resources Are Constrained
假設 implementation / onboarding hours 是唯一真正受限的資源,先把 implementation 本身的成本拿掉,再看其他 contribution:
- A:60,000 − 4,000 support − 1,600 exceptions − 2,000 reporting = 52,400;40 implementation hours,等於 1,310 / constrained hour。
- B:60,000 − 12,000 support − 6,000 exceptions − 5,000 reporting = 37,000;120 implementation hours,約 308.33 / constrained hour。
若 onboarding 確實已滿載,而且公司手上有其他高價值需求,A 對這個 bottleneck 的利用效率高很多,B 的 opportunity cost 也會變得重要。這個排序只對目前這個單一 constraint 成立;一旦同時有多個 constraint、合約義務、策略外溢或容量投資選項,就要換模型。
成本縮回去,速度可能比長上來慢
固定、變動、mixed、step cost 只能在特定 driver、時間與 relevant range 下使用。客服團隊可能在 10,000 到 12,000 tickets 之間不增員,超過門檻才多一個 team;之後 tickets 掉回來,人也不會同步在同一天消失。OpenStax: Cost Behaviour
Anderson、Banker 與 Janakiraman 研究 7,629 家公司後,在該樣本觀察到 SG&A 對營收上升與下降的反應不對稱:營收增加 1% 時,SG&A 平均增加約 0.55%;營收下降 1% 時,SG&A 平均只下降約 0.35%。這兩個係數不能拿去當任何公司的通用 forecasting coefficient;它們支持的是較窄的判斷:活動量下降時,成本不必然按原比例反向縮回。Anderson, Banker & Janakiraman, Are Selling, General, and Administrative Costs “Sticky”?
放回 B 的案例,90 天內可能幾乎沒有 salaried support 或 implementation capacity 能移除;拉到 12 個月,公司才可能透過不補人、重排班表、停掉工具授權、合併團隊或調整設施,把部分容量真正拿掉。這就是 Cost Stickiness 會改變答案的地方。
所以時間 horizon 不是附註。它直接決定「assigned cost」裡有多少真的能變成 avoidable cost。
Allocation 先當訊號,別急著當退出命令
現在加入 corporate / shared-services cost。管理報表暫時用 revenue 當 allocation key,A 與 B 的 revenue 一樣,因此各分到 30,000。
| Lens | Customer A | Customer B |
|---|---|---|
| Gross Profit | 60,000 | 60,000 |
| Less Cost-to-Serve | (11,600) | (35,000) |
| Profit before shared allocation | 48,400 | 25,000 |
| Shared allocation | (30,000) | (30,000) |
| Fully Allocated Profit | 18,400 | (5,000) |
B 在 dashboard 上變成 loss-making customer。這個訊號值得處理:pricing、service entitlement、support burden、客製工作量都應該回頭檢查。它還不能直接告訴你「drop B 會多賺 5,000」。
把決策 horizon 固定在 90 天,再看哪些成本真的會動:
| B 的成本/經濟項目 | Assigned amount | 90-day avoidable cash |
|---|---|---|
| Implementation capacity | 12,000 | 0 |
| Support capacity | 12,000 | 0 |
| Exception handling outsourced cost | 6,000 | 6,000 |
| Custom reporting / ops capacity | 5,000 | 0 |
| Shared corporate allocation | 30,000 | 0 |
| Total immediately avoidable cost | 6,000 |
停止 B 會失去 60,000 Gross Profit,短期只省下 6,000 avoidable cash cost,因此在還沒算 opportunity-cost effects 前,近端變化是 −54,000。
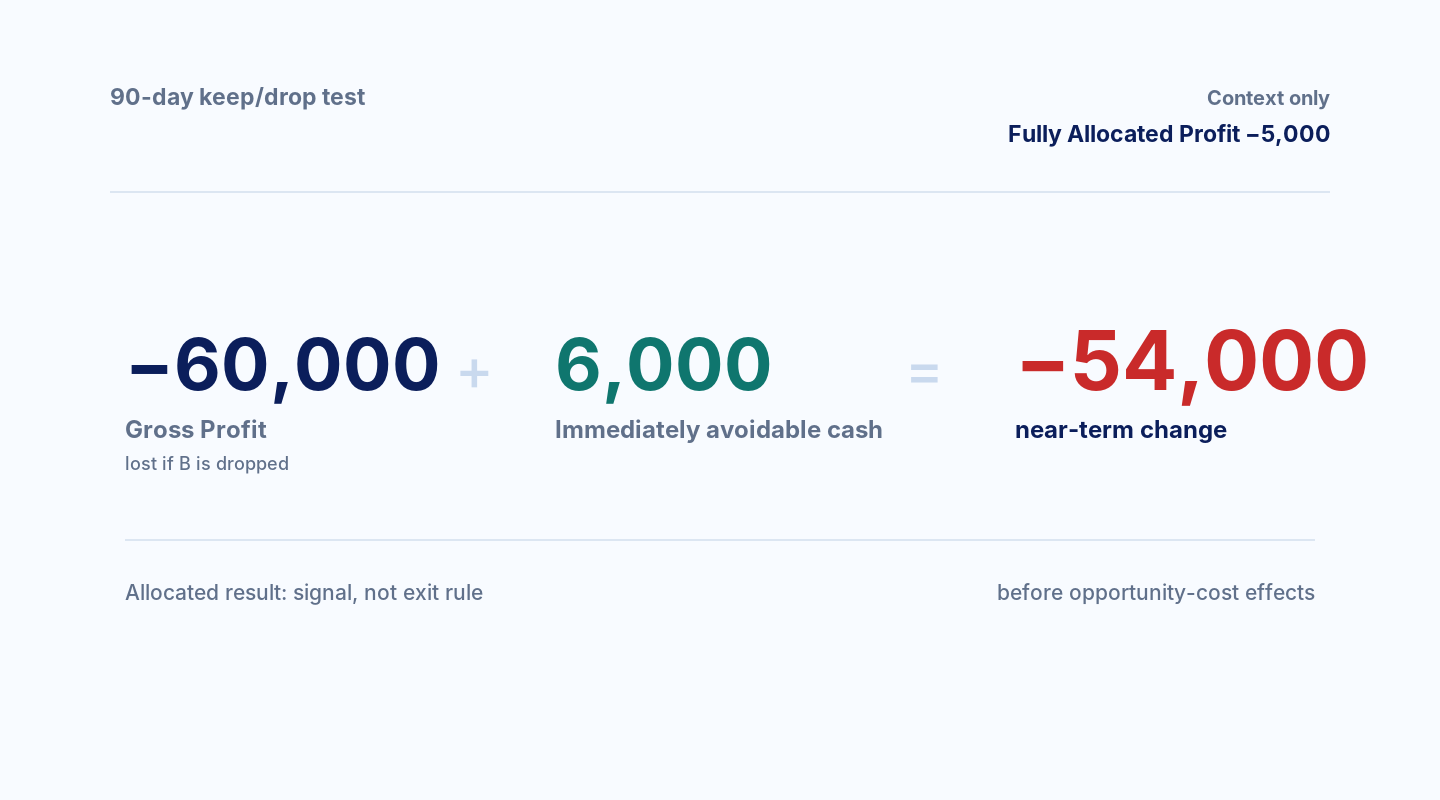
OpenStax 的 keep-or-discontinue 分析採用同一個決策邊界:比較失去的 contribution 與真正能避免的成本,而不是用 fully allocated segment profit 直接下 keep/drop 結論。OpenStax: Keep or Discontinue
Allocation 本身仍然有用,只是用途要寫在模型上。管理成本模型關心資源消耗與 capacity causality;external reporting 受會計準則與報導目的約束;tax / transfer pricing 則有 arm’s-length 與 intra-group service 的規則。三者可能使用不同的 key,也不該互相冒充。
OECD Transfer Pricing Guidelines Chapter VII 對 low-value intra-group services 的 allocation key,就要求依服務性質與預期受益選擇並一致使用。人力、IT、車隊或會計支援可能分別採用 headcount、users、vehicles、transactions 或 assets。這裡引用它,是為了說明 allocation key 需要對應目的與受益關係;它仍然是 tax transfer-pricing guidance,不是所有內部管理成本分攤的通用法規。OECD Transfer Pricing Guidelines 2022
跨期先 reconcile,再談原因
如果整體 customer profitability 比上季下降,可以先用 bridge 把變動拆成 volume / customer count、customer or service mix、Cost-to-Serve intensity、capacity utilisation,以及必要時的 FX、scope、timing 或 allocation method change。方法與 cost object 定義要先固定,所有 component 最後要能加回起點與終點。
Bridge 能整理 arithmetic attribution。它不能單靠自己證明 causal mechanism。Mix shift 與 support hours 同時變動時,你可以先知道各自占了多少數字變化,再另外找證據解釋為什麼會發生。
對 B,先處理能改的那幾件事
目前 90 天的假設只支持一個很有限的結論:avoidable-cost arithmetic 不支持立即 exit B。 這不等於要永久保留 B,因為 horizon、capacity constraint 與替代需求改變後,答案也會改。
管理上可以把下一步縮成四件事。第一,固定 cost object、決策與 horizon,確認現在是在談續約、pricing、keep/drop,還是 capacity planning。第二,把 B 的高 Cost-to-Serve 拆到 onboarding、support、exceptions、custom reporting,找出能先改的 activity。第三,確認哪些 capacity 只是暫時閒置,哪些是真正 binding 的 bottleneck;只有後者才需要把替代需求的 opportunity cost 納入。第四,回頭檢查 allocation key 原本是為責任會計、pricing discipline、外部報導還是 tax compliance 建的。
對 B 而言,短期最值得測的通常不是 termination,而是重新定價、降低 exception demand、把 custom reporting 標準化,或把 scarce implementation capacity 轉給價值更高的工作。若拉長到 12 個月後,support、implementation 或 shared capacity 真的能被釋放,就用新的 horizon 重算,不把 90 天的結果外推成永久結論。
決策停在資源會不會真的改變
下一次有人問「這個客戶到底賺不賺錢?」或「這個產品是不是該砍?」,先確認三件事放在同一張 decision note 上:目前看的 cost lens、決策 horizon 與 capacity constraint,以及採取行動後真正會改變的資源與現金流。
B 的 Fully Allocated Profit 是 −5,000,但目前 90 天可避免的現金只有 6,000。如果沒有新的 bottleneck opportunity cost 或可釋放容量證據,這兩個數字就不能被寫成同一個退出結論。
References
- IMA, Conceptual Framework for Managerial Costing
- IMA, Developing an Effective Managerial Costing Model
- Robert S. Kaplan and Steven R. Anderson, Time-Driven Activity-Based Costing
- Harvard Business School Working Knowledge, Adding Time to Activity-Based Costing
- OpenStax, Identify and Apply Basic Cost Behavior Patterns
- OpenStax, Evaluate and Determine Whether to Keep or Discontinue a Segment or Product
- OpenStax, Evaluate and Determine How to Make Decisions When Resources Are Constrained
- Mark C. Anderson, Rajiv D. Banker and Surya N. Janakiraman, Are Selling, General, and Administrative Costs “Sticky”?
- IFRS Foundation, IAS 2 Inventories
- OECD, OECD Transfer Pricing Guidelines for Multinational Enterprises and Tax Administrations 2022
- AWS, EC2 On-Demand Pricing
- Google Cloud, VPC Network Pricing
- Stripe, Pricing