Runway often gets reduced to a division problem: take cash, divide by burn, and report a number of months. The trouble is that both inputs can hide the decision you actually need to make.
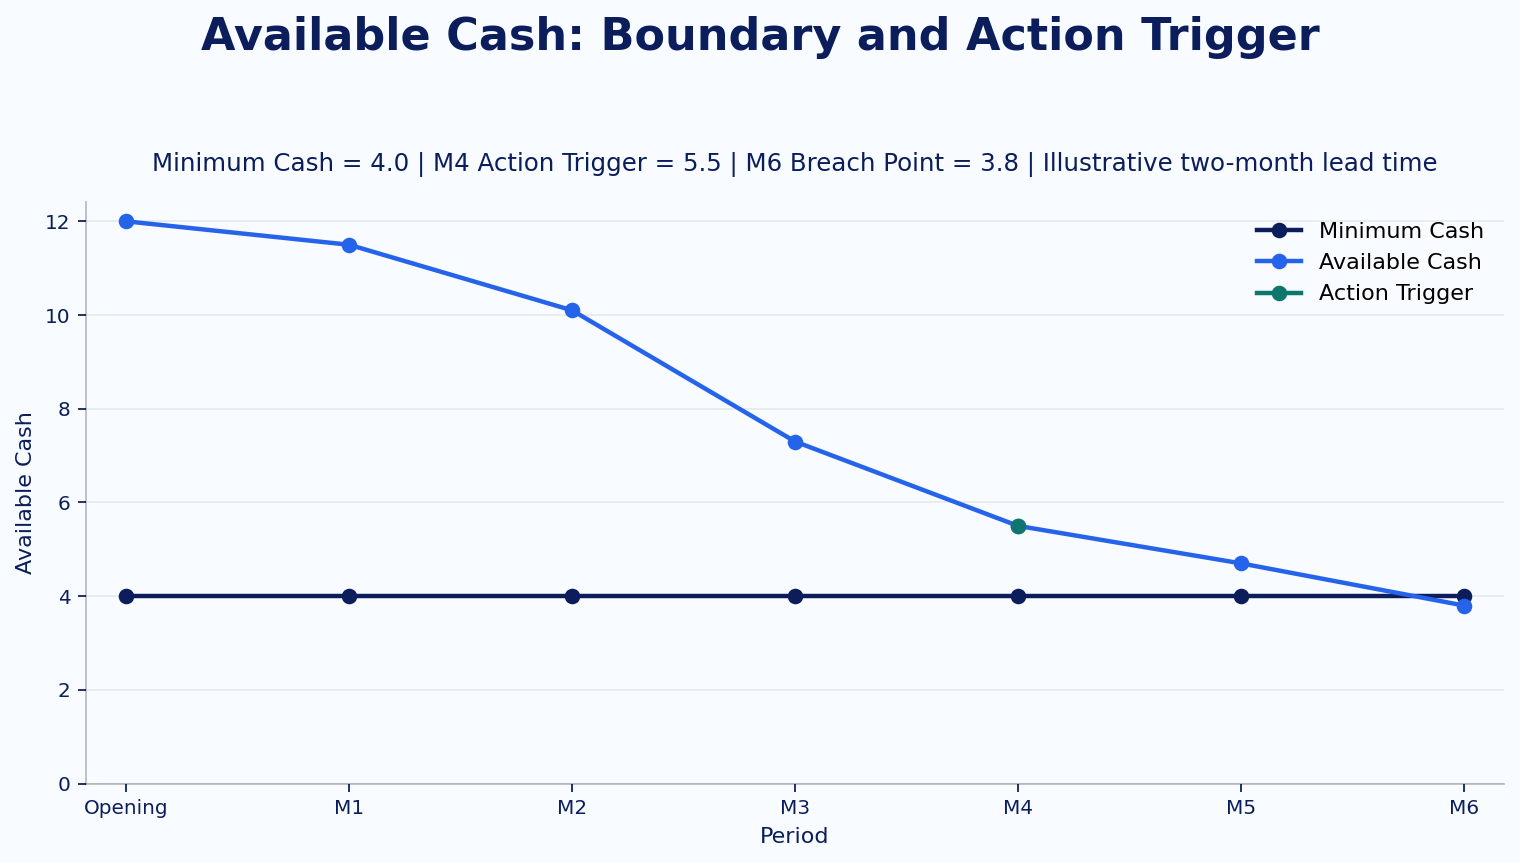
Consider a business with 12.0 of available cash today. Customer receipts rise every month over the next six months, yet the cash schedule ends at 3.8 in M6. Management has chosen 4.0 as its minimum cash buffer. If the response it intends to use needs roughly two months to take effect, the relevant management date is around M4, not M6.
The 4.0 buffer, the two-month lead time and the M4 trigger are all teaching assumptions. They are useful because they force three separate questions onto the same timeline: what cash is genuinely available, what pushes the balance down, and how much response time remains before the boundary is crossed.
The familiar profit-versus-cash distinction sits underneath this analysis, as set out in the IFRS Conceptual Framework. The focus here is narrower: liquidity can become constrained while the bank balance is still positive.
Before Runway, Decide What Counts as Usable Liquidity
A consolidated cash number can include money that will not be available for the next obligation. Restricted balances, customer funds held for a specific purpose, cash in another legal entity, or a facility that still has conditions to satisfy can all sit on a balance sheet without functioning like immediately usable operating cash.
The practical test is timing and access. Can the funds be used legally, by the right entity, under the relevant contract, when the payment falls due? The Association for Financial Professionals frames liquidity around meeting obligations as they arise. US public-company MD&A requirements similarly connect material cash requirements with the sources expected to meet them.
An undrawn credit line belongs in the same analysis only to the extent that it is actually drawable on the required timetable. A nominal facility that cannot be accessed before payroll is not equivalent to cash in the operating account for that payroll decision.
For the rest of this example, 12.0 already means available cash. No further haircut is invented later.
Growth Can Need Financing Before It Produces Cash
The compact working-capital summary is familiar:
CCC = Inventory Days + DSO - DPO
But the equation is more useful after the operating sequence has been unpacked. Inventory can absorb cash before a sale. Receivables can leave revenue recognised while collection is still pending. Payables can delay the cash outflow to suppliers. A profitable order can therefore increase reported performance and still create a temporary financing need if procurement, payroll or fulfilment cash leaves before the customer pays.
That is why AFP’s cash-forecasting material returns to dated receipts and disbursements. The gap is funded in days and weeks, not in the abstract level of a ratio.
CCC still helps organise the diagnosis, provided the underlying conventions stay fixed. DSO, DPO and inventory days need consistent denominators and day counts, and an aggregate ratio can hide ageing, disputes, purchasing changes or inventory mix. The CFA Institute overview explains the mechanics, but it cannot tell management whether a lower number came from healthier operations or a change in mix.
A higher DPO illustrates the problem. It may reflect better supplier terms, or it may mean invoices are simply being paid late. The same applies to a lower DSO if the customer base changes. Actual cash release and counter-metrics have to move with the reported improvement.
Receive-before-pay models introduce another timing shape. Tripadvisor’s 2020 Form 10-K describes a model in which traveller cash was normally received before supplier payment. During the 2020 demand shock and elevated cancellations, new traveller receipts fell while supplier cash outflows continued, reversing the normal working-capital benefit. That filing shows that such a reversal can occur under severe stress; it does not establish a rule for every negative-working-capital business.
Kiymaz, Haque and Choudhury’s 2024 comparative study also finds that working-capital relationships differ across components and economic settings. There is no single CCC level that can be imported as the right answer for every company.
A Forward Cash Schedule Reveals What Average Burn Hides
Short-horizon cash forecasting is useful because obligations arrive on dates. Payroll, tax, supplier payments, refunds, annual software bills, capital expenditure and financing receipts do not spread themselves evenly across a month.
Deloitte’s 13-week cash-flow forecasting is a common practitioner approach to that problem: map near-term receipts and payments, refresh the forecast, and compare it with actual cash movement. Thirteen weeks is neither a statutory rule nor a universally correct horizon. The window has to fit the decision cycle and the speed at which management can respond.
The frozen teaching schedule is below.
| Month | Cash receipts | Cash payments | Ending available cash | Interpretation |
|---|---|---|---|---|
| Opening | – | – | 12.0 | Starting available liquidity |
| M1 | +2.5 | -3.0 | 11.5 | Small net outflow |
| M2 | +2.8 | -4.2 | 10.1 | Inventory / supplier build |
| M3 | +3.0 | -5.8 | 7.3 | Tax + working-capital pressure |
| M4 | +3.4 | -5.2 | 5.5 | Growth continues; cushion narrows |
| M5 | +3.8 | -4.6 | 4.7 | Close to minimum cash |
| M6 | +4.2 | -5.1 | 3.8 | Below the 4.0 minimum-cash boundary |
Receipts rise from 2.5 in M1 to 4.2 in M6, but cash keeps falling because payments are larger and some of them are concentrated in particular periods. A monthly burn average would smooth over that path.
Burn itself also needs a stable definition. Gross burn, net burn and free cash flow answer different questions. Change the cash scope, financing treatment, capex treatment, working-capital assumptions or minimum-cash threshold and the reported runway can change even when the underlying business has not.
In this schedule, the lowest observed balance is 3.8 in M6.
The Relevant Boundary Is 4.0, Not Zero
M6 still has positive cash. That is exactly why the boundary matters.
The company has set minimum cash at 4.0, so M5 at 4.7 remains above the line while M6 at 3.8 is already a breach. The number is not presented as a market benchmark or an IFRS requirement; it is an illustrative management assumption for this case.
A real company would have to build its own buffer from the obligations and uncertainty it actually faces: payroll and other unavoidable payments, variability in collections and disbursements, forecast error, restrictions on specific balances, and the time required for emergency operating or funding actions.
A zero-cash definition would classify M6 as runway remaining. Under this company’s stated boundary, M6 is already outside the acceptable range.
Lead Time Moves the Decision Date Backwards
Different responses run on different clocks. Cancelling discretionary spend can happen quickly. Reducing inventory may take a purchasing cycle. Renegotiating supplier terms requires another party to agree. Bank debt, equity financing or an asset sale can take much longer and can fail before a second option is ready.
Now apply the teaching assumption: the selected response needs about two months of execution lead time. The breach is in M6, so working backwards places the illustrative start point around M4, when ending available cash is still 5.5.
Nothing about that calculation says that fundraising should always begin two months in advance. Change the response and the lead time changes. What matters for this case is simply that the response clock starts before the cash boundary is crossed.
At M4, the company still looks liquid in absolute terms. Under the assumed response time, it is also at the last month from which the chosen action can plausibly reach M6 on time.
Runway Becomes Useful When It Is Reforecast, Not Announced
The working-capital ratios should be tested again when actuals arrive. If DSO falls, did cash collections improve or did customer mix change? If DPO rises, were terms renegotiated or are invoices overdue? If inventory falls, did cash release improve without creating stock-outs or service problems?
The cash path can move for reasons that never appear in a static runway label. An early customer receipt may lift the low point. A delayed collection or a wave of refunds may pull the breach forward. Each change also alters the amount of time available for the chosen response to take effect.
Return to the frozen case. It starts at 12.0, reaches 5.5 in M4 and falls below the 4.0 minimum in M6. With a two-month response assumption, M4 is the working trigger today.
If next month’s actuals move the breach from M6 to M5, that same response would suddenly have only one month left.
References
- IFRS Foundation – Conceptual Framework for Financial Reporting
- IFRS Foundation – IAS 7 Statement of Cash Flows
- Association for Financial Professionals – Keeping the Lights On: The Why and How of Liquidity Management
- Association for Financial Professionals – Cash Forecasting: A Free Cash Flow Perspective
- Deloitte – 13-Week Cash Flow Forecasting
- 17 CFR § 229.303 – Management’s Discussion and Analysis
- CFA Institute – A Look at the Cash Conversion Cycle
- Kiymaz, Haque & Choudhury – Working capital management and firm performance: A comparative analysis of developed and emerging economies
- Tripadvisor, Inc. – 2020 Form 10-K