Forty-two metrics, and no clear management answer
Northstar Commerce is a fictional e-commerce company with a very full Monday dashboard. It carries 42 metrics. Revenue, traffic and Conversion Rate are green. Contribution Profit has barely moved. Return Rate is deteriorating. Growth says Conversion Rate is 4.4%; Finance says 3.8%.
Forty-five minutes into the meeting, the team still cannot connect those readings to a common decision. They have not agreed which outcome is being managed, which operating mechanisms might explain movement in it, which measures deserve recurring attention, or even whether a familiar KPI name refers to one calculation.
Adding another chart would leave those questions intact. The missing layer is Metric Architecture: an explicit connection from business outcome to hypothesised drivers, metric roles, operating definitions and ownership.
Start from the decision the metric is supposed to support
A metric estate can grow almost accidentally. A field already exists in the warehouse, a competitor reports something similar, or an executive asks for a number once and it never disappears. None of those is, by itself, a management reason to promote the measure into a recurring KPI.
For Northstar, the underlying concern is that revenue growth is not translating cleanly into better profit quality and customer experience. That gives the measurement system something concrete to organise around.
The worked outcome in this article is a simplified Contribution Profit: revenue less the major costs that vary with transactions, including product, payment, fulfilment and return-related costs. It is a teaching identity for Northstar, not a standard accounting definition and not a formula other companies should copy.
With the outcome fixed, candidate metrics can be screened against use. If a sharp move in a number would not change any judgement, priority or action that the team can name, it may still be useful for diagnosis. It is not yet a strong recurring management KPI.
Build the Driver Tree as an investigation map
Northstar can now break Contribution Profit into operating hypotheses. A first layer might cover Demand / Traffic, Conversion / Basket Economics, Repeat / Retention Behaviour, and Variable Fulfilment Economics. Beneath those branches sit measures such as Sessions, Conversion Rate, Average Order Value, Repeat Purchase Rate, Return Rate, Fulfilment Cost per Order and On-time Delivery Rate.
The important discipline is attached to the arrows. They describe mechanisms the team believes may matter; they do not certify causality.
If On-time Delivery Rate and Repeat Purchase Rate fall together, delivery experience is a reasonable branch to investigate. The tree alone cannot establish that slower delivery caused lower repeat purchasing. Price, product mix, promotions, seasonality, customer composition or a measurement change could have moved at the same time.
That makes the Driver Tree useful for deciding where to look next. It is closer to an investigation map than a causal model: explicit enough to challenge, but still open to evidence that weakens or strengthens a branch.
Decide which measures belong in the management layer
Once the tree is populated, the challenge changes. Plenty of nodes may be worth measuring without deserving a permanent place in the executive view.
For this teaching case, Northstar assigns roles as follows:
- Outcome metric: Contribution Profit
- Driver metrics: Conversion Rate, Repeat Purchase Rate, Average Order Value, Fulfilment Cost per Order
- Guardrail metrics: Return Rate, On-time Delivery Rate
- Diagnostic metrics: more granular channel, device, warehouse, campaign, cohort or product-level measures
The seven executive-facing measures are illustrative. They are not a universal recommendation about KPI count.
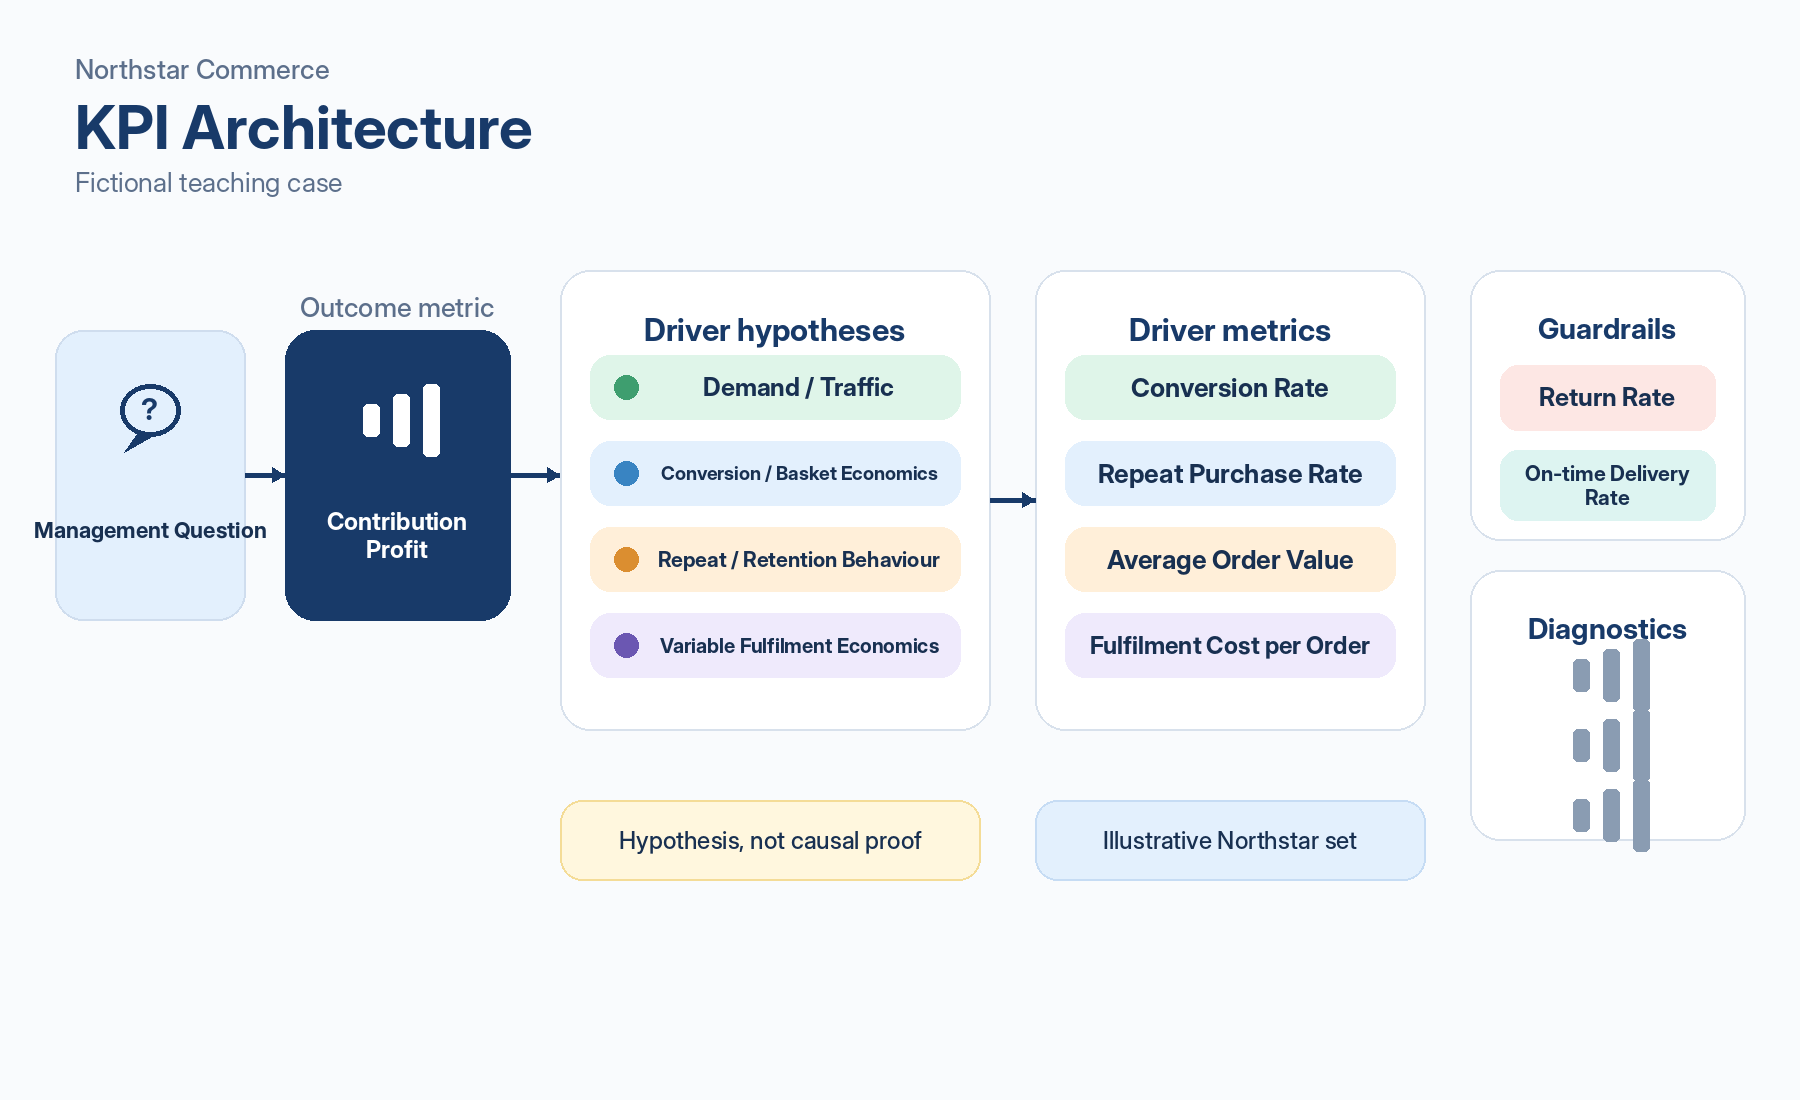
A recurring measure needs a reason to be there: its role should be clear, its movement should plausibly alter interpretation or priority, and its connection to an outcome or driver should be visible. The deeper diagnostics remain available without asking senior management to watch all of them continuously.
Guardrails become especially useful when a team can improve one metric by damaging another part of the system. Northstar could push Conversion Rate upwards through more aggressive promotions or product promises while Return Rate worsens. In that case the conversion gain needs a different interpretation.
Performance measurement can also change behaviour. A review of 76 empirical studies found effects on behaviour, organisational capabilities and performance, with results varying by design and context. That is enough reason to consider what might be sacrificed when a measure becomes the number everyone is trying to improve, without assuming that every KPI automatically creates gaming.
A Metric Contract turns a KPI name into a reproducible measure
Growth’s 4.4% Conversion Rate and Finance’s 3.8% can both be internally consistent. The disagreement may sit in the denominator, bot treatment or the event used to assign the conversion date. One team can divide by product-view sessions while the other uses all sessions; one can remove bot traffic while the other does not; one can use order creation while the other uses payment completion.
Before comparing the percentages, the team needs to know which metric it is comparing. A Metric Contract provides that operating definition. It is not a legal contract and the field set below is not an official universal standard for internal KPIs.
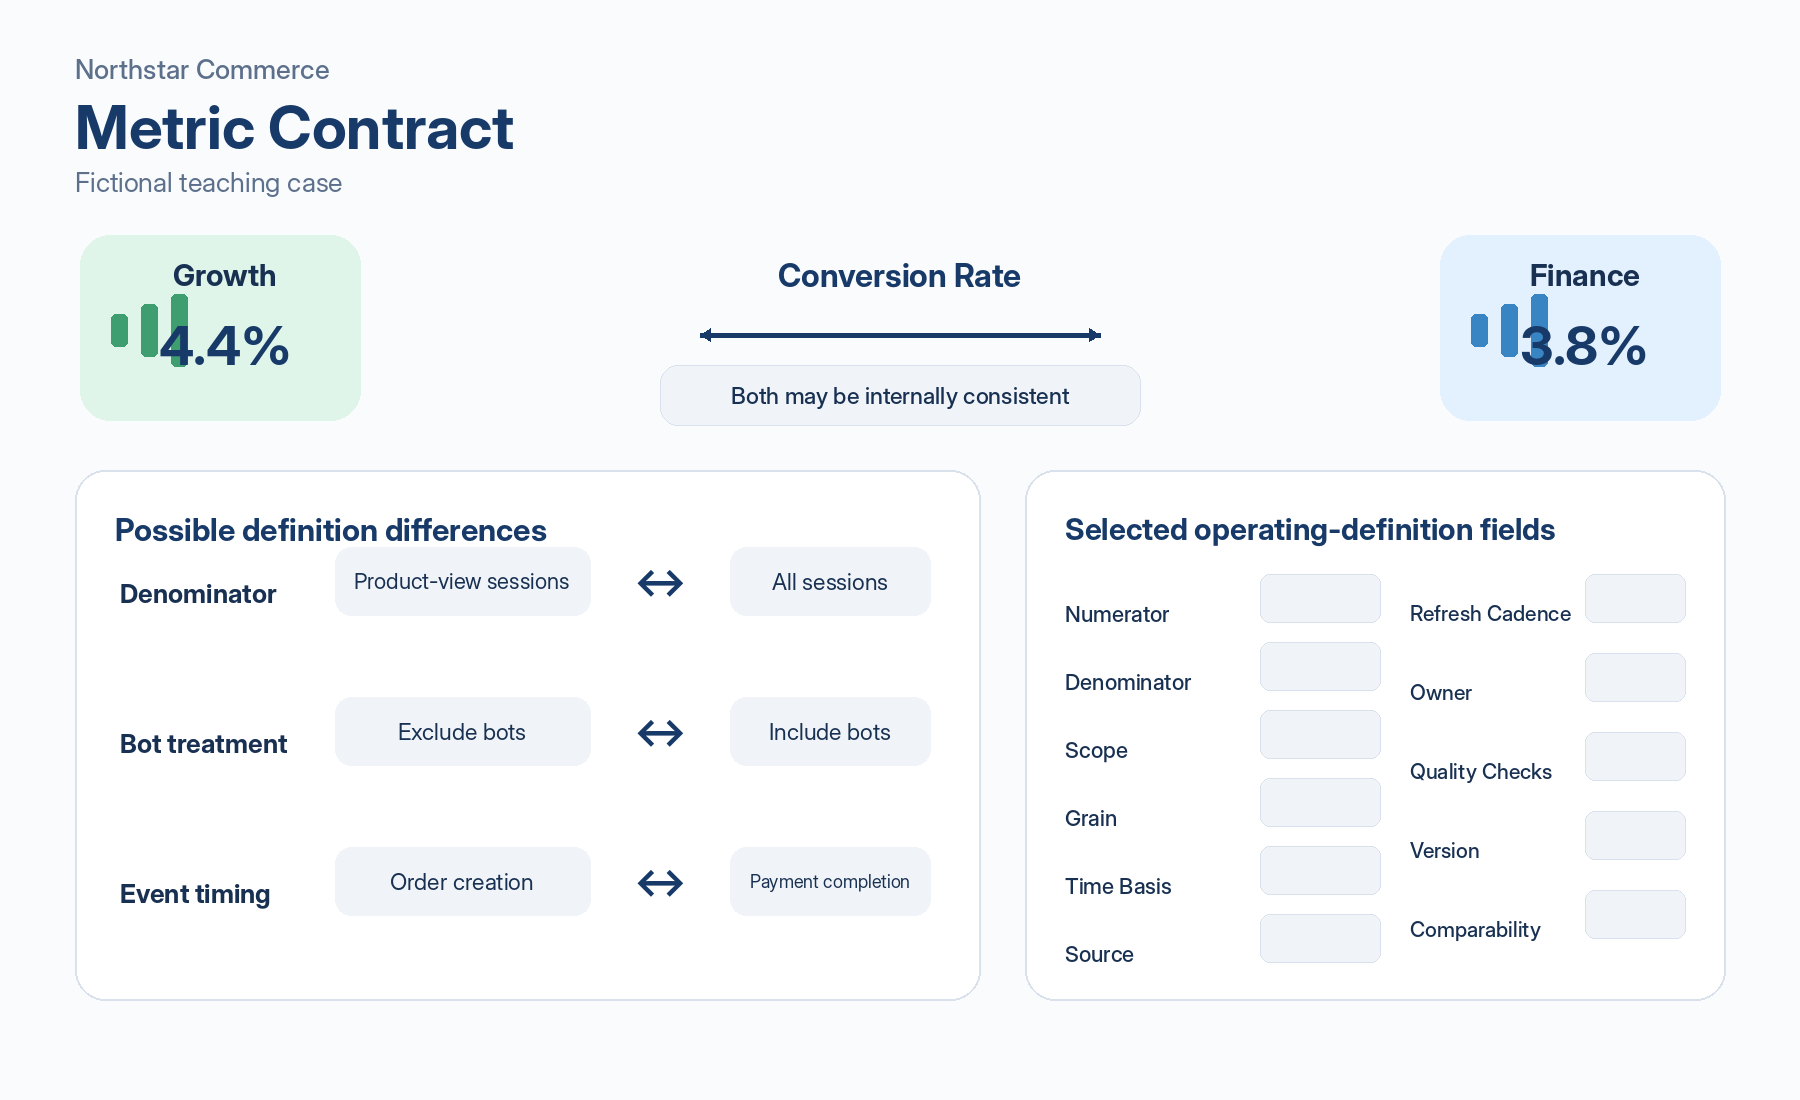
For Conversion Rate, the contract needs enough detail for another operator to reproduce and maintain the number. In practice that means specifying the numerator and denominator; included population / scope; measurement grain; time basis and time zone; the canonical source; refresh cadence; definition and data-quality ownership; quality checks for issues such as bots, duplicate events, missing orders or late-arriving data; version handling when formulae or sources change; and the comparability treatment applied after a definition change.
There are useful external parallels for this governance discipline. U.S. SEC guidance for KPIs and metrics in public-company MD&A discusses, where applicable, the context needed to understand how management uses a metric and how it is calculated, as well as material changes in calculation or presentation. The UK’s Financial Reporting Council likewise discusses definitions, calculation methods, data sources, assumptions, consistency, significant changes and the relationship between KPIs and how the board manages the business.
Those are public-reporting contexts, not legal requirements for an ordinary internal dashboard. The transferable lesson is narrower: when a number influences a decision, its definition and changes need to be inspectable rather than residing only in one person’s memory.
Versioning matters for the same reason. Event definitions, data sources, business processes and calculation logic can change. Without a change log, two periods labelled “Conversion Rate” can quietly contain different formulae.
Use the opening dashboard as a stress test
Suppose the same Northstar dashboard now shows Revenue up, Conversion Rate up and Average Order Value broadly flat. It still looks healthy at first glance. Elsewhere, Return Rate is rising, Fulfilment Cost per Order is rising, Repeat Purchase Rate is falling in a high-value cohort, Growth and Finance still use different Conversion Rate definitions, and no one clearly owns Return Rate data quality.
Start with the outcome. Higher revenue does not establish that Contribution Profit improved. If the outcome is weak, the Driver Tree tells the team where to investigate rather than treating every green headline as good news.
Conversion Rate itself still needs interpretation. A rise may reflect a real operating improvement, a shift in traffic mix or a definition change. At the same time, deteriorating Return Rate and fulfilment cost change the economic meaning of the apparent growth.
Then there is measurement trust. If the definition, source, owner or version is unclear, the argument about 3.8% versus 4.4% is premature because the team has not yet established one shared measure.
Nothing in that diagnosis says that 42 metrics are inherently too many. Diagnostic depth can be useful. The failure occurs when measures are promoted into the management system without a clear outcome, role, definition, guardrail or owner.
Trace one KPI backwards before calling the system ready
A practical final check is to take one metric that senior management sees repeatedly and trace it backwards.
Can the team name the management question it serves and its role as an outcome, driver, guardrail or diagnostic measure? If it is a driver, can the team state the current hypothesis connecting it to the outcome and what evidence might weaken or strengthen that hypothesis? Can another operator reproduce the number from its numerator, denominator, scope, time basis and source? Are definition ownership, data-quality ownership and historical comparability clear when the definition changes? And if everyone pushes hard on the KPI, which guardrail is most exposed?
Repeated gaps in that trace are a sign that the Metric Architecture is still unfinished.
Only after this layer is stable does it make sense to ask what counts as good or bad performance. The next article separates targets, thresholds, benchmarks and control limits. The following layer covers dashboards and WBR / MBR / QBR operating cadence: when metrics are reviewed, where, and who acts. OKRs, strategy deployment, controls and incentives come later in the governance layer.
The order protects the management system from becoming very sophisticated around a number that nobody has defined properly.
References
- U.S. Securities and Exchange Commission, Commission Guidance on Management’s Discussion and Analysis of Financial Condition and Results of Operations, 2020.
- Financial Reporting Council, Guidance on the Strategic Report, February 2026, especially paragraphs 8.17–8.20 on KPIs.
- Franco-Santos, M., Lucianetti, L. & Bourne, M., Contemporary performance measurement systems: A review of their consequences and a framework for research, Management Accounting Research, 2012.
- Financial Reporting Council, Corporate Governance Code Guidance, guidance context on information, responsibilities, controls and escalation.