“Productivity” is an awkward word once very different kinds of work sit on the same management dashboard.
A company can report more revenue per employee after cutting headcount. A software team can double deployment frequency. An AI agent can complete more tasks at a lower cost per request. All three figures can move in the preferred direction while the underlying system deteriorates.
The first company may have lost scarce skills and pushed the remaining workload onto fewer people. The engineering team may be creating more failed changes and rework. The agent may be confidently reporting success without producing the required change in the system of record.
The common error is to treat output as though it were already an outcome. It is not. Before deciding whether any of these systems improved, management needs to know what was measured, what stayed comparable, what quality bar was held, and what the apparent gain cost elsewhere.
A number needs a contract before it needs a target
Consider three ordinary phrases: output per employee, deployment frequency, and agent success rate. Each sounds precise. None is interpretable until its boundary conditions are clear.
Who counts as an employee? Are two periods measuring the same service and roughly the same workload? Does an agent “succeed” because it says the task is complete, because a grader approves the response, or because the required end state can be verified externally?
For this article, I use metric contract as shorthand for those boundary conditions. It is an analytical device, not the formal name of an external standard. A workable contract fixes the unit of analysis, denominator, population or workload, segment, time window, measurement method, and intended decision use. Change any of them materially and the same formula may answer a different question.
This is also why DORA cautions against context-free comparisons across unlike applications or services and against turning a metric mechanically into a target. Gaming is one failure mode. False comparability is another.
People metrics fail quickly when the denominator becomes the story
Revenue per employee is a useful example because the arithmetic is simple and the interpretation is not.
If headcount falls while revenue remains steady, the ratio rises. At company level, that may tell us something about the cost structure or the amount of revenue supported by the current workforce. It does not establish that each remaining employee became more productive. The same period could include the loss of critical capability, higher voluntary turnover, or workloads that are being sustained only through overtime and burnout.
The population definition can change the conclusion just as easily. Hiring time across the whole company may conceal a persistent problem in one hard-to-fill role. Turnover depends on the population and denominator used. A skills-coverage percentage means little until we know which skills and which workforce it covers.
ISO 30414:2025 is useful here because its human-capital reporting scope is broad: workforce composition, costs, productivity, health and well-being, leadership and culture, recruitment, mobility and succession, turnover, skills and capabilities, and other areas. It does not reduce organisational health to a single labour-efficiency ratio.
That breadth matters more than any one metric. The operating question is whether the organisation still has the capability to perform important work sustainably. Engagement and well-being can contribute evidence about that condition, but they should not be promoted into automatic claims about profit without a causal design that supports the claim.
Engineering needs several instruments because “faster” can describe a worse system
Software delivery has unusually good examples of what happens when a metric is kept inside its proper scope.
DORA currently uses five software-delivery performance metrics: change lead time, deployment frequency, failed deployment recovery time, change fail rate, and deployment rework rate. Together they capture more than pace. Failure, recovery, and rework sit beside flow.
Suppose deployment frequency doubles. If change failures rise, rework expands, and a critical service repeatedly misses its SLO, the team has certainly changed its delivery pattern. Calling the whole engineering system “twice as productive” would add a claim the metrics do not support.
The SPACE framework addresses a different part of the problem by treating developer productivity as multidimensional. That is important precisely because commits, tickets, lines of code, deployments, or any other activity measure can become misleading when asked to represent the whole job.
Reliability introduces another instrument. Google SRE’s SLI, SLO, and error-budget model links reliability to user-relevant service behaviour and to an explicit trade-off: how much reliability headroom is available before faster change becomes irresponsible? Security deserves the same care. NIST’s Secure Software Development Framework is organised around risk-based practices and outcomes rather than a universal contest to drive raw vulnerability counts to zero. Scan coverage, exposure, complexity, and remediation practices all affect what a count means.
For an engineering review, I would therefore resist any single composite “productivity” score. Delivery flow, stability and reliability, risk, and developer experience answer different questions and should remain visible as different questions.
AI agents create a more basic problem: the output can lie about the outcome
The cleanest way to see this is to ignore the language model’s final sentence and inspect the environment.
A booking agent can say that a reservation has been confirmed. If no reservation exists in the system of record, the task failed. A polished completion message is not a substitute for the end state.
Anthropic’s agent-evaluation guidance separates task, trial, grader, transcript or trace, and outcome. That decomposition is valuable because it stops one success flag from swallowing the whole process. We can inspect what the agent attempted, what tools it used, where the trace failed, how a grader judged the run, and whether the environment ended in the required state.
Reliability then requires repetition. A stochastic system that succeeds once has demonstrated possibility, not consistency. Repeated trials let us distinguish between a system that can succeed at least once and one that succeeds reliably across attempts. The distinction matters operationally even when both systems have the same best-case demo.
Capability benchmarks and subsystem scores remain useful, but they answer narrower questions. RAGAS, for example, separates dimensions of retrieval and generation quality. GAIA tests capabilities such as multi-step reasoning and tool use. Neither score, by itself, says whether an agent should be expanded on a particular production workload.
Production adds costs and failure paths that benchmarks may not capture: latency, turns, tool calls, token usage, retries, fallbacks, human escalation, error rates, and the consequences of safety, security, privacy, or policy failures. NIST’s Generative AI Profile places evaluation within that wider risk and trustworthiness lifecycle.
One measurement grammar, three different metric systems
At this point it is possible to reuse a structure without pretending the metrics themselves are interchangeable. The six layers below are an author synthesis for this article, not a shared standard issued by ISO, DORA, NIST, or another body.
-
Outcome. For People, this can include retained capability and organisational or business results that can be attributed with appropriate care. For Engineering, it includes successful delivery and user or business outcomes. For an AI agent, the anchor is a verified task or end state.
-
Flow or capacity. Hiring and internal mobility describe part of workforce capacity; lead time and deployment flow describe software delivery; throughput, turns, and tool steps describe agent execution. These are movement measures, not proof of value on their own.
-
Quality and reliability. Workforce-quality and health signals matter for People. Engineering needs failure, recovery, SLOs, and incidents. Agent systems need correctness, grounding where relevant, and consistency across repeated trials.
-
Economics. Labour and hiring costs need a defensible denominator. Engineering and infrastructure costs need a stable workload. Agent economics can be measured per task, but the more useful denominator is often verified success once failure and retry costs matter.
-
Guardrails. Well-being, fairness, privacy, and culture constrain People decisions; security, reliability, and developer experience constrain Engineering decisions; safety, security, privacy, policy, and human escalation constrain agent deployment.
-
Context contract. Role and population define the People comparison. Service, change type, and workload define much of the Engineering comparison. Task, workflow, trial design, and task distribution define the Agent comparison. Time window and measurement method belong in all three.
This gives managers a common sequence of questions while leaving each domain’s metrics intact. A retention rate should not be ranked against a change fail rate, and deployment frequency should not be treated as the same construct as agent throughput. “Context before benchmark” is therefore a rule about matching comparisons, not a rejection of benchmarking itself.
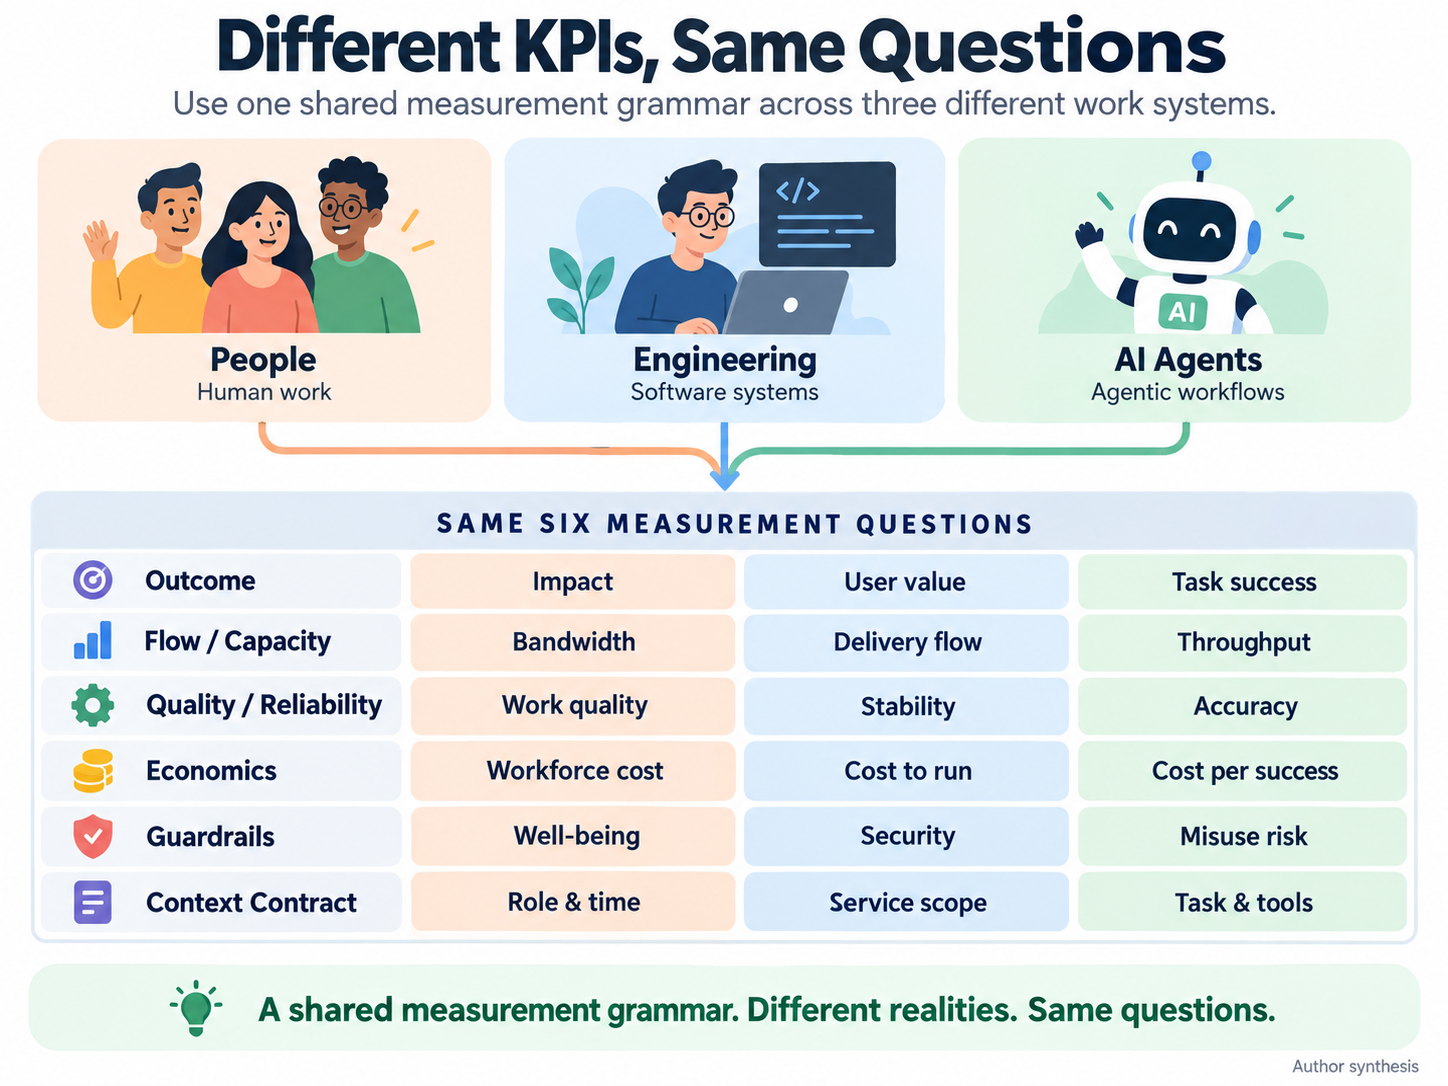
A shared measurement grammar does not create a shared productivity score; the questions are common, the metrics are domain-specific.
Cheap requests can produce expensive outcomes
Agent economics makes the sequencing problem easy to see. Cost per request can fall while the system becomes less economical because failures, retries, fallbacks, or human hand-offs increase.
A useful management heuristic is:
Cost per successful task = attributable agent/model/tool/runtime cost ÷ verified successful outcomes
This is not an industry-standard formula. It simply moves the denominator from activity towards useful outcomes.
The formula is only as good as its cost boundary and success definition. Teams still need to decide whether retries, tooling and infrastructure, fallbacks, and human handling are included, and whether the workload distribution is stable enough for a before-and-after comparison.
There is no reason to force People or Engineering into the same equation. The transferable idea is narrower: cost should be interpreted after the useful outcome and quality threshold are known. An agent can become cheaper per request and more expensive per verified success at the same time.
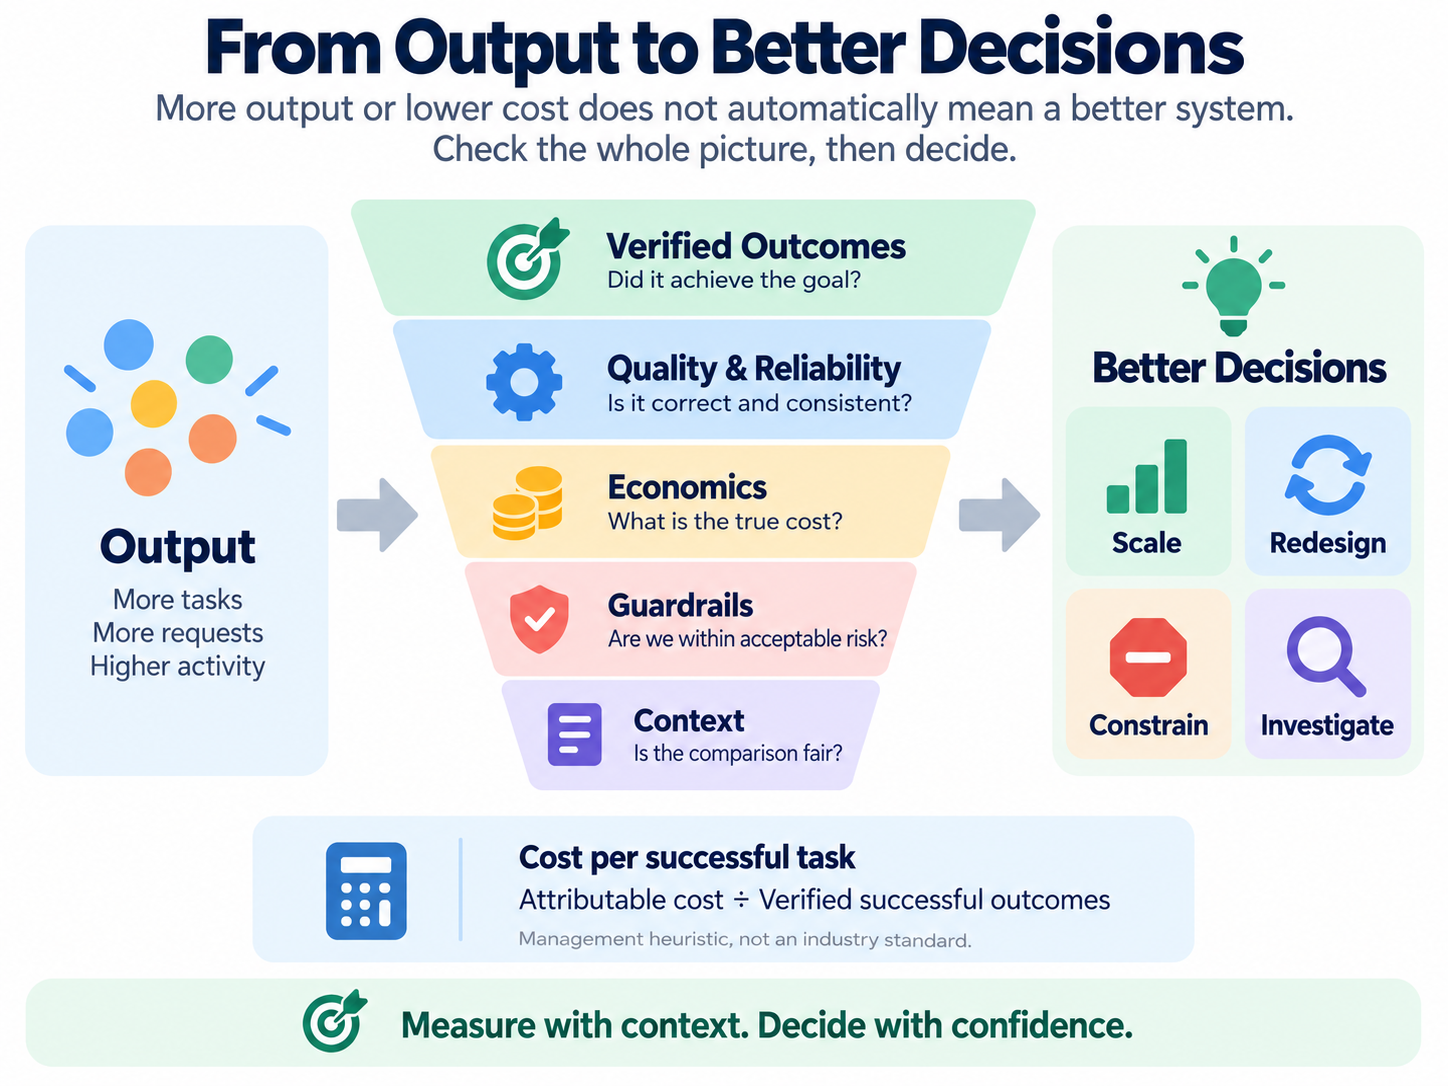
More output or lower request cost is not enough; management action follows verified value, reliability, economics, risk and a fair comparison context.
What the dashboard should change is the decision, not the adjective
When an output metric moves, there are four useful management responses in this framework.
| Action | When it fits |
|---|---|
| Scale | The verified outcome improves, quality/reliability holds, economics improve under a comparable context, and guardrails remain intact. |
| Redesign | The outcome is valuable, but the process, quality, or reliability mechanism is not good enough. |
| Constrain | A safety, privacy, well-being, reliability, or other operating boundary is being breached even if output looks attractive. |
| Investigate | The population, service, task distribution, cost boundary, or measurement method changed enough that the comparison itself is uncertain. |
Those actions can be applied to People, Engineering, and AI agents without pretending that the three systems share a productivity score. The discipline is to establish the measurement architecture first, then decide what the movement in the numbers actually warrants.
References
- ISO 30414:2025 — Human resource management: Requirements and recommendations for human capital reporting and disclosure
- DORA — Software delivery performance metrics
- Forsgren et al. — The SPACE of Developer Productivity
- Google SRE — Service Level Objectives
- NIST — Secure Software Development Framework (SSDF)
- Anthropic — Demystifying evals for AI agents
- NIST — Artificial Intelligence Risk Management Framework: Generative Artificial Intelligence Profile
- RAGAS: Automated Evaluation of Retrieval Augmented Generation
- GAIA: a benchmark for General AI Assistants