A green KPI is evidence that something moved. It is not yet an explanation of what happened to the business.
Take three examples. A Fintech platform reports higher TPV. A Neobank reports rising ARPAC. A hotel group posts record RevPAR. Each number can improve for reasons that have very different consequences for revenue quality, margins and risk.
TPV tells us that more eligible transaction activity moved through a defined perimeter. ARPAC tells us how much revenue is associated with the company’s definition of an active customer. RevPAR tells us room revenue per available room. None of those definitions, on its own, answers whether the underlying economics improved.
The work starts by recovering the metric’s boundaries and then tracing the number into the business model.
Fintech and Neobanks: follow the money beyond volume
Nu Holdings is a useful place to start because its Purchase Volume is explicitly company-defined. The metric covers specified credit and prepaid-card transactions; it does not represent every movement of money across Nu’s ecosystem. A growth rate is therefore meaningful only after the eligible transaction set is understood.
Monetisation is a separate step. Card and payment economics vary by product, rail, card type, regulation and commercial agreement. US debit-card data under Regulation II, for example, differ by network, message type and covered versus exempt status. A model that applies one take rate to all volume can miss that mix.
For analysis, I would trace the flow this way:
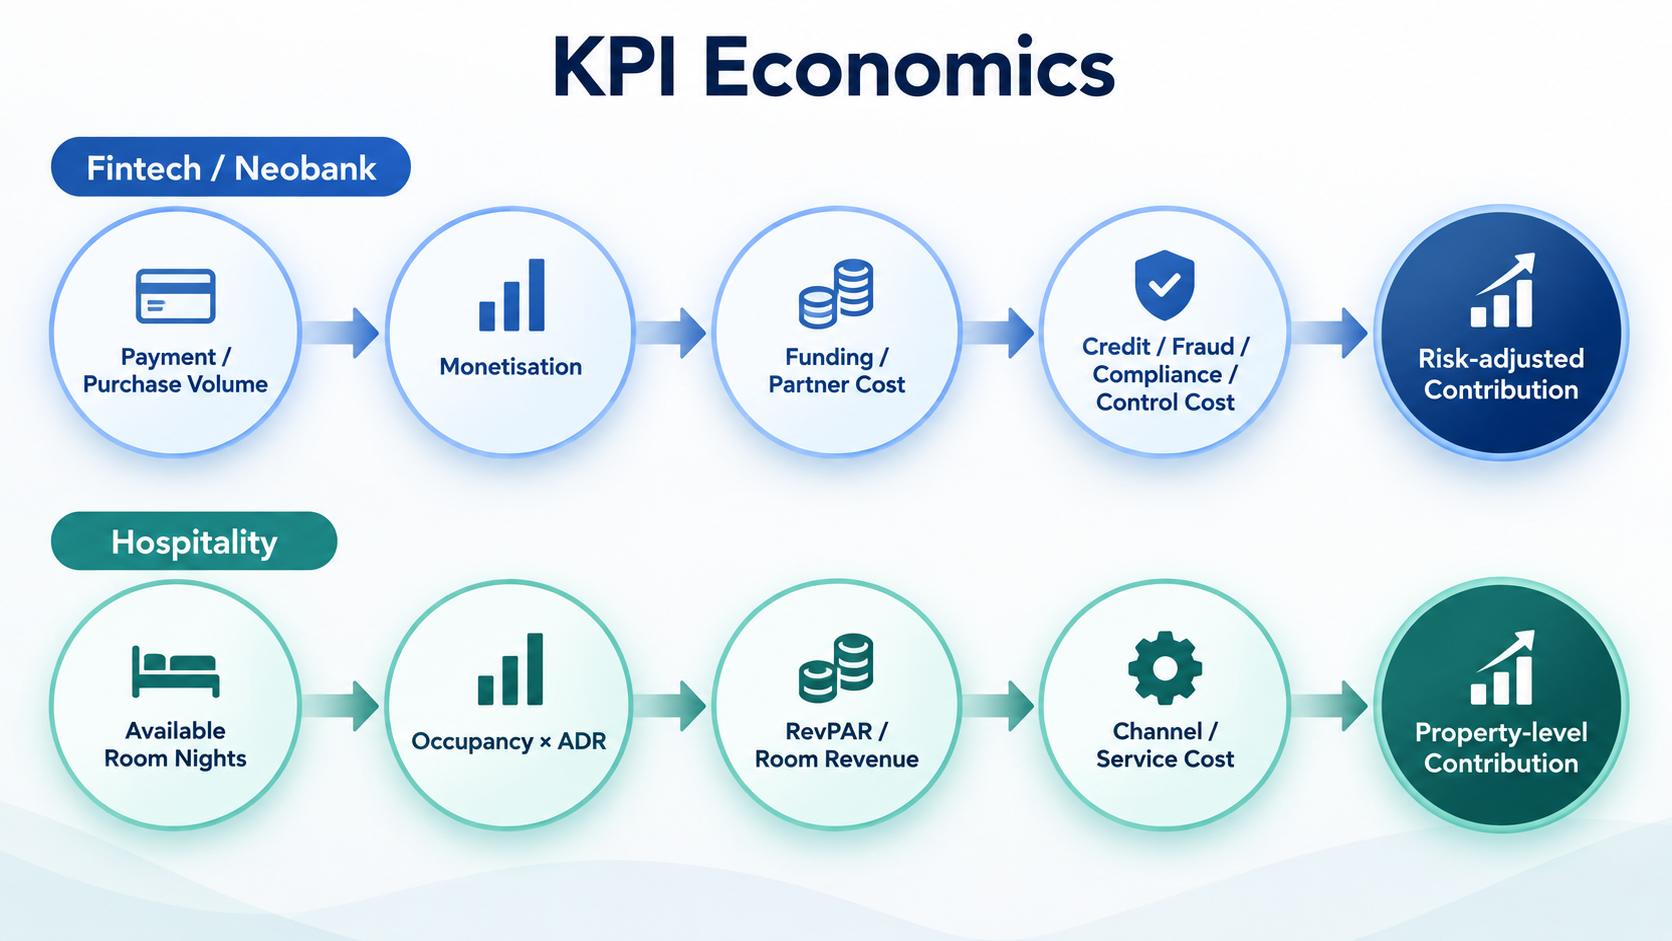
Payment / Purchase Volume → Monetisation → Funding / Partner Cost → Credit / Fraud / Compliance / Control Cost → Risk-adjusted Contribution
The arrow chain is a diagnostic sequence rather than an accounting identity. It forces a volume story to survive several tests before it becomes an earnings story.
A 20% increase in TPV could coincide with a weaker product mix. Network, partner-bank or rewards costs could rise faster than revenue. A larger lending book could raise interest income while expected credit loss deteriorates. Fraud performance could improve on the headline measure while false declines, manual review or support workload become more expensive.
ARPAC has a different denominator problem. Nu defines both Average Revenue Per Active Customer and the active-customer population used in that calculation. A stricter activity definition can shrink the denominator; a richer customer mix can raise the average. Neither change necessarily means that an existing customer became more profitable. Cost-to-serve and the source of the revenue still matter.
The term “Neobank” introduces another source of false equivalence. Some firms are largely partner-bank and fee businesses. Others hold deposits, lend from the balance sheet and carry credit risk. For the latter group, analysis has to reach deposits, funding cost, net interest income or margin, credit losses, capital, liquidity, servicing, collections and compliance costs. SoFi’s public reporting illustrates those layers clearly.
Third-party banking arrangements do not remove the regulated bank’s responsibility either. FDIC, Federal Reserve and OCC guidance keeps responsibility for safe, sound and compliant activity with the bank, while the agencies’ statement on third-party deposit arrangements highlights recordkeeping, reconciliation, liquidity, consumer and third-party risks. The operating model matters because the ledger, the money and the risk can sit in different places.
AI changes the cost stack before it changes the economics
An AI deployment can make an operating metric look excellent very quickly. Suppose support handling time falls by 40%, or a KYC review requires materially less manual effort. Those results describe workflow efficiency. They are not, by themselves, a financial return.
A decision model has to include costs that the headline automation metric does not show:
Gross automation benefit − inference / vendor cost − exception handling − human review − monitoring / evaluation − remediation / control burden
NIST’s AI Risk Management Framework materials, the GenAI Profile and the Measure Playbook all treat monitoring, human oversight, evaluation, errors and overrides as part of operating an AI system. Those activities can consume money even when the automated path becomes faster.
Banking model-risk governance adds another relevant boundary. Where SR 26-2 applies, validation, monitoring, limitations and fit-for-purpose controls remain part of the control environment. Its scope should not be overstated: the guidance is not a GenAI- or agentic AI-specific rule.
For a Fintech operator, the practical test is simple enough. Put inference and vendor spend, exceptions, human review, monitoring and remediation into the same economic view as the time saved. Only then does an efficiency metric become useful for an ROI discussion.
Hospitality: RevPAR needs a path, not just a percentage
Hospitality gives us a different set of measures. Occupancy is sold room nights divided by available room nights. ADR is room revenue divided by sold room nights. RevPAR is room revenue divided by available room nights, which gives the familiar identity:
RevPAR = Occupancy × ADR
That identity is operationally useful, but RevPAR is still a room-revenue measure. It does not include all hotel revenue and it is not profit. Hyatt, for instance, distinguishes RevPAR from ancillary and other non-room revenue.
Now consider two purely illustrative routes from RevPAR 70 to 77:
| Scenario | Occupancy | ADR | RevPAR |
|---|---|---|---|
| Starting point | 70% | 100 | 70 |
| Mainly rate-led | 70% | 110 | 77 |
| Mainly occupancy-led | 77% | 100 | 77 |
Both outcomes produce 10% RevPAR growth. The operating workload is different. The occupancy-led case requires more occupied rooms and therefore normally more housekeeping, utilities, amenities and service activity. Hilton and Hyatt disclosures help explain why rate-led and occupancy-led growth can have different cost consequences.
I would therefore read the property economics through this bridge:
Available Room Nights → Occupancy × ADR → RevPAR / Room Revenue → Channel / Service Cost → Property-level Contribution
The next question is whose economics are being measured. A hotel property and an asset-light hotel group do not share the same perimeter. Hilton operates across management, franchise and ownership structures, and contractual fees can connect to room revenue, gross operating revenue or operating profit. Marriott explicitly warns that RevPAR should not be assumed to correlate with its fee revenue.
That distinction matters for an owner, a manager, a franchisor and a consolidated group in different ways. One occupied room night can create value at several layers without creating the same margin at each layer.
Distribution is another source of divergence. Two properties with identical RevPAR can have different net economics if one relies more heavily on third-party channels. Xenia discusses OTA concentration, commissions and customer-acquisition costs in its public disclosures. The point is not to infer a universal OTA commission benchmark; it is to keep distribution cost inside the analysis.
Hospitality therefore needs hospitality measures: occupancy, ADR, RevPAR, room inventory, channel mix, cancellations, service measures, ancillary revenue, property profitability and seasonality. Comparability should not require translating those concepts into SaaS or Marketplace vocabulary.
A 10-field Metric Contract makes different industries comparable without flattening them
The common discipline sits one level above the KPI name. Before I use a metric in a peer comparison, a trend analysis or a benchmark, I want ten fields fixed:
| # | Metric Contract field | Question to answer |
|---|---|---|
| 1 | Economic unit | What is the underlying unit: transaction, customer, room night, loan, order? |
| 2 | Numerator | Which revenue, volume or events are included? |
| 3 | Denominator / eligibility | What qualifies for the denominator or population, and what is excluded? |
| 4 | Time window / cohort | Daily, monthly, quarterly, LTM? Current users or a specific cohort? |
| 5 | Entity / legal perimeter | Which legal entity, asset, property or partnership owns the metric? |
| 6 | Product / channel perimeter | Which products, payment rails, channels or geographies are included? |
| 7 | Cost boundary | Which variable, partner, service or acquisition costs have been deducted? |
| 8 | Risk boundary | Are credit, fraud, dispute, compliance or model risks reflected? |
| 9 | Currency / comparison basis | How are FX, constant currency or comparable sets handled? |
| 10 | Source / version / lineage | Which reporting version defines the metric, and has the formula changed? |
This is the reconciliation framework used in this article, not an accounting or regulatory standard.
Purchase Volume and RevPAR show why the contract is more useful than a shared vocabulary. Purchase Volume usually describes a defined set of eligible transaction value before network, partner, fraud and similar costs; it is not ordinarily a credit-, fraud- or compliance-adjusted return measure. RevPAR describes room revenue per available room before housekeeping, distribution and other property costs; it is not a risk-adjusted profit measure either.
The remaining fields then decide whether any comparison is valid. Reporting period, entity perimeter, product or property set, currency basis, comparable-property rules and the company’s current definition all have to line up closely enough for the comparison being attempted. Reconciliation also exposes same-name/different-meaning metrics, different labels for similar economics, and conflicts in formula or grain before those differences disappear into a benchmark table.
Benchmarking fails when the contract changes quietly
Most bad comparisons do not announce themselves. They often appear as clean time series.
A denominator can drift when “active customer” is redefined. Product or customer mix can shift and lift an average without improving the economics of the original base. A perimeter mismatch can pair a property metric with corporate fee revenue, or an app-engagement measure with the returns of a balance-sheet lender. Costs and risks can leak outside the KPI while the KPI itself improves. FX treatment, comparable sets, classifications or metric formulas can also change between periods.
Any one of those changes may be enough to stop the comparison. “Not comparable yet” is a valid analytical result when the reconciliation has not been completed.
Applied to the three opening examples, the checks are different. Rising TPV needs a monetisation, cost and risk bridge. Rising ARPAC needs the active-customer denominator, revenue definition, mix and cost-to-serve. Rising RevPAR needs the occupancy-versus-ADR path, distribution and service costs, plus the property-versus-corporate perimeter.
The growth rate becomes economically useful only after those questions have answers.
Define → Bridge → Reconcile → Compare → Decide
When TPV, ARPAC and RevPAR are all rising, the correct conclusion is not automatically positive or negative. The sequence is Define → Bridge → Reconcile → Compare → Decide.
Define the metric as the company actually uses it. Bridge it into the business model. Reconcile denominator, perimeter, cost, risk and lineage. Then compare periods or peers and make the decision the analysis was meant to support.
A dashboard can tell you where to look. It cannot tell you, without that work, which part of the economics actually improved.
References
- FDIC / Federal Reserve / OCC, Interagency Guidance on Third-Party Relationships: Risk Management
- FDIC, Agencies Issue Statement on Bank Arrangements with Third Parties to Deliver Bank Deposit Products and Services
- Nu Holdings, 2025 Form 20-F
- Nu Holdings, Q2 2025 filing and metric glossary
- Federal Reserve, Regulation II Average Debit Card Interchange Fee by Payment Card Network
- SoFi Technologies, 2025 Form 10-K
- NIST, Artificial Intelligence Risk Management Framework: Generative Artificial Intelligence Profile
- NIST AI RMF, Measure Playbook
- Federal Reserve, SR 26-2: Revised Model Risk Management Guidance
- Hilton Worldwide Holdings, 2025 Form 10-K
- Marriott International, 2025 Form 10-K
- Hyatt Hotels, 2025 Form 10-K
- Xenia Hotels & Resorts, 2025 Annual Report