Suppose a refund agent receives a task: investigate an inconsistent refund, reconcile the order, payment provider and audit record, then open a repair ticket if required.
A few minutes later, the interface shows two lines:
Run failed.
Tool execution error.
The operator still does not know:
- Which turn failed?
- Which context and policy versions were active?
- Which tool call failed, and were its arguments valid?
- Did the tool fail, or was the response lost after an external side effect occurred?
- Why did the agent retry, and how many attempts were made?
- Which worker consumed the time and budget?
- Did the verifier run, and why did it not catch the problem?
- Is the failure associated with one model, prompt, tool or configuration version?
A terminal error message cannot answer any of these questions.
One agent task can cross model calls, retrieval, tools, approvals, workers, background jobs, verification and several state transitions. Operating that system requires more than an HTTP request log, token totals or the final answer.
It needs an evidence chain that correlates intent, decisions, actions, evidence, versions and outcomes.
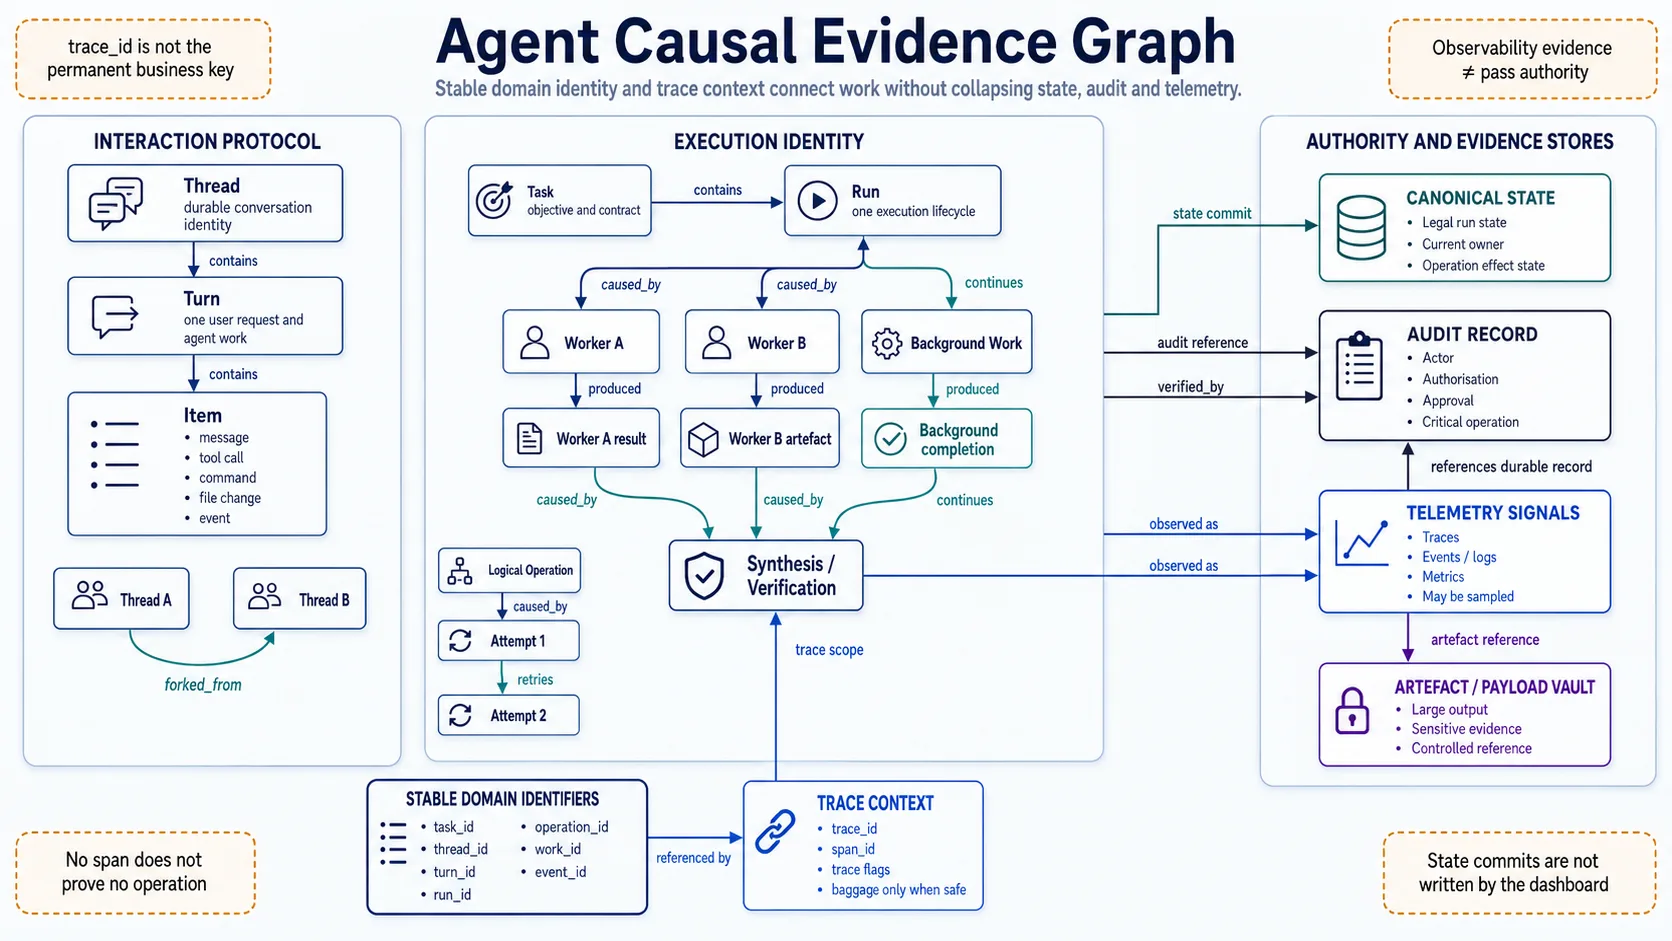
Figure 11-1 | An agent trace must connect threads, turns, items, spans, workers, tools, approvals, verification and versions through one causal chain.
Observability explains what happened; it does not declare that the work was good
Part 10 separated quality control from evaluation. Observability occupies another layer.
- Quality control decides whether one run may pass.
- Evaluation measures an agent system across cases, trials, and versions.
- Observability collects, correlates, and queries execution signals for diagnosis, comparison, investigation, and reconstruction.
- Canonical state determines the run’s legal current state.
- Audit records retain decisions and operations that must support accountability, compliance, or later proof.
The layers may share identifiers, but they are not substitutes.
| Question | Primary responsibility |
|---|---|
| What happened in this tool call? | Observability |
Is the run running, paused, or failed? | Canonical RunState |
| Which actor approved an operation under which policy version? | Audit record |
| Did the output satisfy the completion contract? | Quality control |
| Did this version regress on refund tasks? | Evaluation |
A trace can show what a verifier returned without establishing that the verifier was trustworthy. A metric can show a falling pass rate without defining an acceptable quality level.
Telemetry may also be sampled, exported late, dropped, or removed under retention policy. Data that serves as state authority or mandatory audit evidence cannot exist only in a best-effort tracing pipeline.
Therefore:
Observability is an evidence interface, not the state database, quality judge, or compliance ledger.
When visibility and authority are collapsed, a polished dashboard becomes an expensive confidence machine.
Why a conventional request log is insufficient
A web service often uses one request ID across a gateway, application and database. An agent run has a longer and more branching lifecycle.
One user request may involve:
- Creating or resuming a thread
- Starting a turn
- Building context
- Calling a model
- Discovering that a tool is required
- Waiting for approval
- Executing the tool in another worker or service
- Returning an observation
- Replanning
- Starting background work
- Running verification
- Producing artefacts and a terminal status
Any stage may retry, pause, reconnect, fork, time out or hand work to another agent.
If all of that becomes:
POST /agent/run 500 18423msthen the log proves that the request failed and records its duration. It does not identify the tool, turn, policy version or side effect involved.
The OpenAI Codex App Server models interaction as threads, turns and items, while streaming ordered status and event updates. That protocol shape is itself an observability foundation because one client request can produce many structured events rather than one response. 1
Runtime observability and process observability describe two kinds of truth
An agent harness must observe both system execution and task control.
Runtime observability
This layer answers infrastructure and execution questions:
- Is the service available?
- Is the queue blocked?
- Where did model or tool latency increase?
- What error did a dependency return?
- What happened to CPU, memory, connection pools and worker saturation?
- Did an external side effect occur?
- Did retry, timeout and recovery follow policy?
This extends the familiar logs, metrics and traces of distributed systems. Google SRE identifies latency, traffic, errors and saturation as the four golden signals commonly used to monitor a service. Agent runtimes still need that baseline. 2
Process observability
This layer answers task and control questions:
- What goal, scope and completion contract did the agent receive?
- Which plan did it use?
- Why was this tool selected?
- Which policy decision allowed or blocked the action?
- Why did the system retry, fall back or escalate?
- Which evidence supported completion?
- At which turn did the task begin to drift?
- Where did a person intervene?
Process observability does not require storing a model’s private reasoning. It should record observable inputs, decisions, actions, results, evidence and state transitions, rather than treating unobservable internal reasoning as an operational fact.
A complete task trace can be represented as:
Intent
→ contract and policy
→ context and plan
→ model decision
→ tool or action
→ runtime evidence
→ verification
→ repair or escalation
→ completion or stop
Runtime observability alone may reveal a tool timeout without explaining why the tool was called. Process observability alone may show the plan while missing a saturated connection pool or a dependency returning HTTP 429.
Both views need to meet in the same trace.
Correlation model: agent work is usually a causal graph, not a tidy tree
The first observability problem is identity, scope, and causality rather than dashboards.
Thread, turn, and item describe the interaction protocol. Task, run, worker, and operation describe execution. Trace and span describe an observational view. They are not one hierarchy and should not be compressed into one universal identifier.
A common relationship looks like:
Tenant / Actor
        │
      Task
        │
     Thread ── contains ── Turn ── contains ── Item
        │                    │
        └──── linked to ─── Run
                             │
                    fan-out / fan-in
                   ┌─────────┼─────────┐
                Worker A  Worker B  Background Work
                   │         │           │
                Model      Tool       Completion Event
                   └─────────┴──── causal links ─────┘
                             │
                    Verification / Artefact
Stable identity and trace context have different jobs
Useful fields include:
tenant_idactor_idor delegated principaltask_idthread_idturn_idrun_iditem_idtrace_idandspan_idworker_idandworker_roletool_call_idapproval_idcheckpoint_idartifact_idoperation_idwork_idevent_id
A trace_id joins one observational scope; it need not become the permanent primary key for business or runtime state. Work that survives traces, restarts, or retention windows needs stable domain identifiers.
Causal links are needed beyond parent and child
The following are not always simple parent/child relationships:
- one coordinator fans out to several workers
- several worker results feed one synthesis
- background work finishes after the original turn
- a retry creates a new attempt for the same logical operation
- A2A or a queue crosses process boundaries
- verification reads several artefacts and external states
Represent such relationships explicitly, for example:
caused_bycontinuesretriesforked_fromproducedverified_bysupersedes
Across processes, queues, background workers, and agent messages, propagate trace context and retain stable domain identifiers. Inferring causality from nearby timestamps is less correlation than constellation drawing after an incident.
A telemetry contract must separate signals, cardinality, sampling, and audit
Ad hoc span names work briefly and then produce:
agent_call
agent_request
llm_run
model_execution_v2
call_agent_final
The names may represent one operation or five different boundaries. A versioned normalisation layer should map internal names to the pinned semantic convention without discarding product-specific meaning.
OpenTelemetry core Semantic Conventions were at 1.43.0 in July 2026. GenAI conventions have moved to a separate repository, and several agent and framework conventions remain marked Development. Implementations should pin the GenAI convention revision, instrumentation version, and internal mapping rather than merely claim to be “OTel compatible”.34
Spans, events or logs, metrics, and audit records are different
| Signal | Suitable question | Should not own |
|---|---|---|
| Span or trace | Operation boundary, latency, causality, dependency | Permanent state authority |
| Event or log | Discrete fact, transition, error, diagnostic | High-volume aggregate trend |
| Metric | Rates, distributions, capacity, SLOs, trends | Complete history of one run |
| Audit record | Accountable actor, decision, operation, evidence reference | Large debugging payload |
| Artefact or payload vault | Large output, sensitive evidence, controlled content | Dashboard labels |
In 2026, OpenTelemetry also began moving new event conventions towards log-based events rather than placing every discrete event on a span. Existing data remains valid, but one timeline representation should not be mistaken for a permanent signal contract.5
A minimal tool span may contain:
{
  "schema_version": "agent-telemetry-2.0",
  "semantic_convention": "otel-genai@pinned-revision",
  "trace_id": "tr_8a1f",
  "span_id": "sp_42",
  "span_type": "tool.execute",
  "task_id": "refund-reconcile-204",
  "run_id": "run_8a1f",
  "worker_role": "refund-investigator",
  "tool_name": "payment.lookup_refund",
  "tool_version": "3.4.0",
  "operation_id": "op_771",
  "policy_decision_id": "pd_19",
  "status": "error",
  "error_class": "dependency_timeout",
  "effect_state": "unknown",
  "latency_ms": 3120,
  "content_recording": "metadata_only",
  "redaction_class": "payment_restricted"
}
The record describes observational identity, versions, outcome, and data policy. It does not establish that the tool result was correct or that the span reached the collector.
Do not place unbounded identity in metric labels
A run_id, user_id, complete argument object, prompt digest, or every artefact identifier belongs in traces, logs, billing records, or exemplars rather than unbounded metric labels.
Metric labels should use bounded dimensions such as:
- model family
- worker role
- tool class
- status class
- tenant tier
- deployment version
- risk class
Otherwise the time-series backend may become the first incident demonstrated by the monitoring design.
Sampling and audit retention are separate
Trace sampling may retain:
- errors and unknown outcomes
- high-risk operations
- SLO breaches
- high latency or cost
- rare paths
- a random baseline
through head or tail-based policies.
The following normally must not disappear merely because a trace was not sampled:
- approval and denial
- credential or policy change
- external side-effect operation identifier
- completion decision
- security incident
- required compliance record
Those belong in durable audit or state paths and may be referenced by the trace.
Full content should not be recorded by default
Prompts, tool arguments, retrieved documents, and tool results may contain personal data, secrets, payment data, source code, or cross-tenant content.
A safer strategy is:
- metadata by default
- content opt-in
- field-level redaction
- sensitive payloads in a separate vault linked by reference
- tenant-aware and purpose-bound access
- retention classes and legal hold
- trace-access audit
- region and encryption policy
- alerts for redaction failure
Do not permanently place every full prompt in every span for convenience. Observability should not quietly grow into a second data lake overnight.
A trace should explain causality, waiting, and state change
A useful agent trace covers at least:
- request or run start
- policy resolution
- context build
- model call
- retrieval
- tool proposal, authorisation, execution, and result
- approval wait and decision
- retry, fallback, or recovery
- background acceptance, completion, and delivery
- checkpoint and resume
- verification
- state transition
- artefact creation
- terminal status and stop reason
The OpenAI Agents SDK currently creates traces or spans for runs, agents, model generations, function tools, guardrails, and hand-offs. Codex also documents OTel metrics for turns, tools, approvals, MCP calls, hooks, and multi-agent activity. These product examples show that agent observability extends beyond one model request, but their field shapes remain product implementations rather than a universal harness schema.67
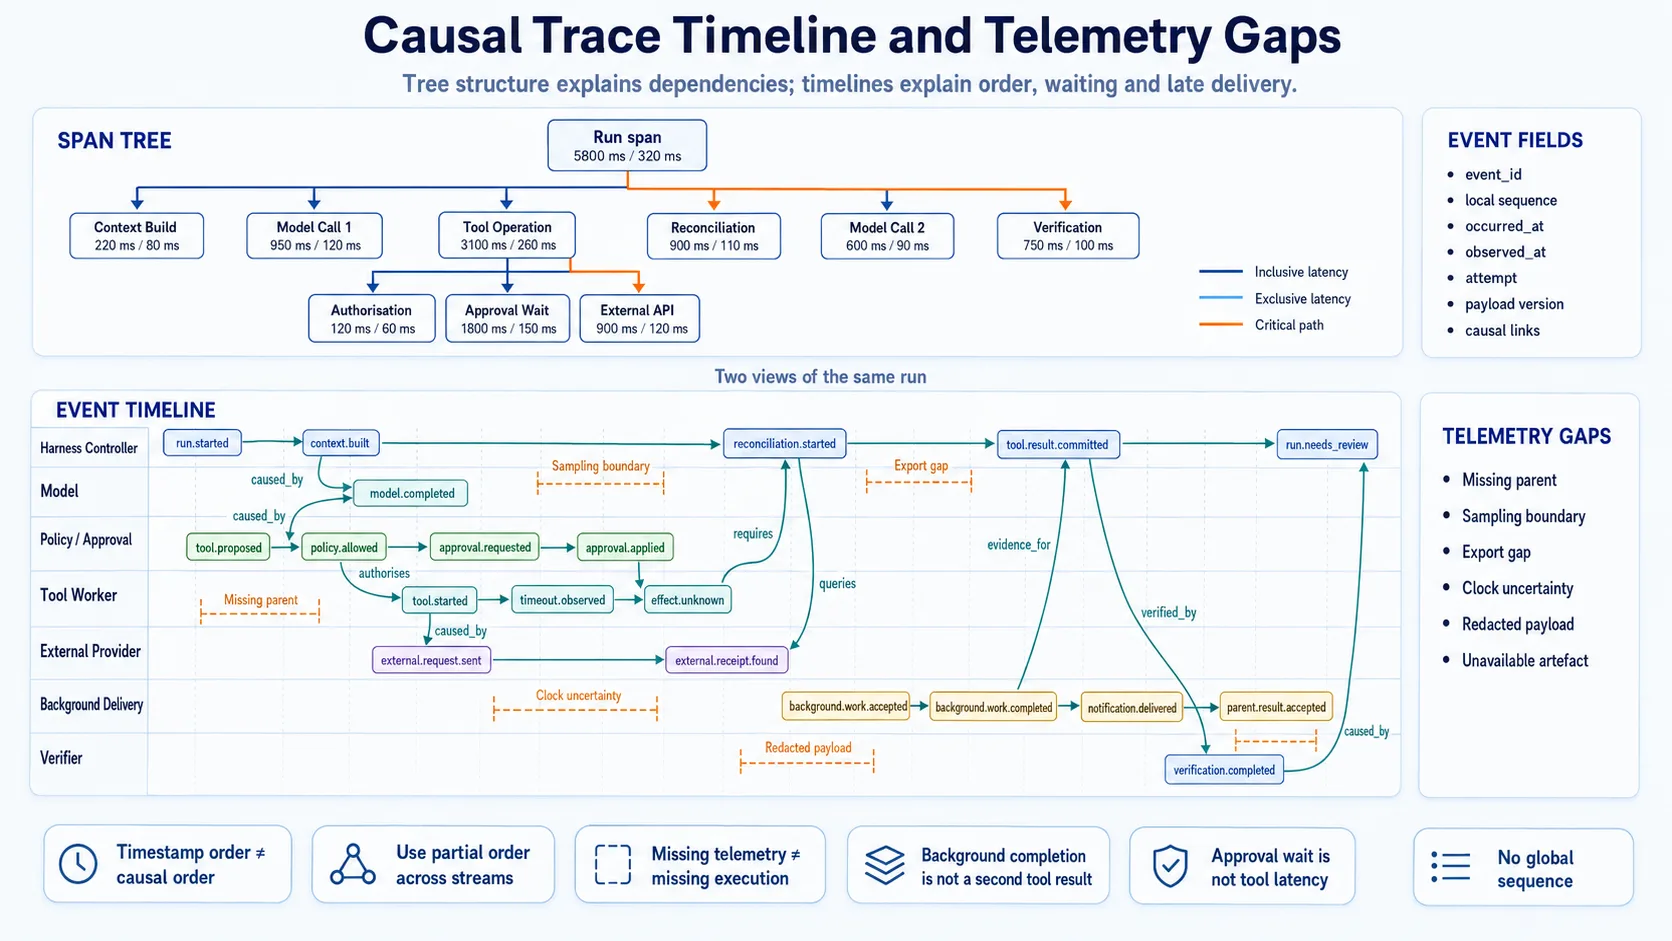
Figure 11-2 | The same run should support a span tree for dependencies and latency, an event timeline for order and waiting, and causal links for work that does not form a tree.
Span trees and event timelines serve different purposes
A span tree is useful for:
- nested operations
- inclusive and exclusive latency
- dependency chains
- worker fan-out
- external-service time
An event timeline is useful for:
- approval waiting
- queue delay
- reconnect catch-up
- pause, resume, and cancel
- background completion delivery
- ordering around policy or configuration changes
They should share stable identifiers and causal links rather than rely on two unrelated instrumentation systems.
Timestamps do not establish causality on their own
Distributed events may arrive late because of clock skew, batch export, queues, or network delay. Sorting solely by wall-clock time can display a result before its request.
An event contract should retain:
- a globally unique
event_id - a stream-scoped monotonic
sequence occurred_atobserved_atoringested_at- parent span or causal links
- attempt or generation
- event and payload versions
- terminal status
- acknowledgement or delivery state
Do not claim one perfect global sequence across the distributed system. A practical design maintains local order for a thread, run, work unit, or event stream and joins them through links into a partial order.
Trace gaps must remain visible
Instrumentation fails, collectors drop data, and sampling omits spans. If a viewer silently closes every gap, it creates a false history.
A trace view should identify:
- missing parent
- incomplete export
- sampling boundary
- clock uncertainty
- redacted payload
- unavailable artefact
- instrumentation-version change
No span means only that no span is available. It does not prove that no operation occurred.
Metrics should connect service health to task outcomes
An agent dashboard should display more than total tokens. At least four groups are useful.
Service metrics
- availability
- queue time
- turn latency
- time to first model item
- model and tool latency
- error rate
- saturation
- recovery time
- event-export and collector health
Process metrics
- turns per task
- tool calls per task
- retry and repair iterations
- approval wait time
- human-intervention rate
- context growth
- goal-drift and escalation count
- background-work completion delay
- result-delivery and acknowledgement delay
Quality-evidence metrics
- verified-completion rate
- evidence completeness
- verifier
fail,needs_review, andunresolved - correction and rejection rate
- unsafe-action attempts
- duplicate side effects
- completion-decision latency
These are observational signals rather than quality authority. Fewer turns may mean efficiency or premature stopping; a rising verifier-failure rate may reflect a verifier-version change.
Economic metrics
- cost per run
- cost per verified successful task
- wasted retry cost
- evaluator overhead
- human-review minutes
- retrieval and tool data volume
- artefact-storage cost
- telemetry-collection cost
Average request cost often lacks enough meaning for agents. Eligible tasks, verified successful tasks, or completed business units are usually more useful denominators.
A metric needs a definition, not only a name
For each important metric, retain:
- numerator
- denominator
- eligible population
- window
- aggregation
- unit
- missing and late-data policy
- version
- owner
A verified_completion_rate is not comparable until it defines eligible tasks, treatment of needs_review, and the maximum decision delay.
Use exemplars to connect aggregates to traces
Metric labels should retain bounded cardinality. To move from a P95 spike to concrete runs, use exemplars, trace links, or a query index rather than placing every run_id in the time series.
A metric identifies where a problem may exist. Traces and evidence records identify the affected runs, operations, and contract versions.
Multi-agent attribution must avoid double charging and time illusions
Coordinator, research worker, tool worker, reviewer, and evaluator costs should not be collapsed into one number. Nor should all worker durations be summed and labelled end-to-end latency.
Each worker should retain:
- role
- model and profile
- input, output, reasoning, and cached tokens
- queue, wall-clock, active, idle, and tool latency
- tool calls and raw-data volume
- retry and repair iteration
- artefact bytes
- outcome status
- direct monetary cost
Also distinguish:
- End-to-end wall-clock: how long the user waited.
- Summed worker time: total active time across workers.
- Critical-path time: the path that determined completion time.
- Inclusive cost: cost including child work.
- Exclusive cost: cost owned only by this worker.
- Shared-cost allocation: treatment of common context building, caches, coordination, or verification.
If a coordinator span includes child spans and billing counts both inclusively, the dashboard becomes a cost-duplication machine.
Per-worker attribution should answer:
- which worker repeatedly loaded the same context
- whether parallelism reduced time or merely increased total cost
- which role sat on the critical path
- whether review created low-value repair loops
- which workers can use a less expensive model
- which worker produced verifiable artefacts or evidence
Cost comparisons require the same task, completion contract, and verification rigour. A worker that is cheaper because it gives up earlier is not more efficient.
Replay is not one button; it has at least three meanings
The phrase recorded reconstruction suggests that a model and the external world can be reproduced perfectly. For most agent systems, recorded reconstruction, controller replay, and sandbox re-execution are more honest names.
Recorded reconstruction
Use retained events, result summaries, state snapshots, and artefact references to rebuild the original timeline.
Suitable uses include:
- incident investigation
- user-interface playback
- decision and evidence review
- inspection of the state known at the time
It does not call the model or external systems again and cannot recover details that were never recorded.
Controller or mocked replay
Run the controller, workflow, or agent loop again while replacing model and tool dependencies with recorded results or test doubles.
Suitable uses include:
- reproducing retry, approval, and failure branches
- validating state transitions
- testing client and event handling
- comparing controller versions
The replay engine should check:
- recorded-input schema
- tool and model adapter versions
- event ordering
- missing or redacted payloads
- unsupported historical events
- the expected determinism boundary
If the controller reads today’s policy or the latest tool catalogue, it is no longer the same replay contract.
Sandbox re-execution
Execute the same task or selected steps in a new isolated environment.
Suitable uses include:
- validating a repair
- comparing harness versions
- running a regression trial
- reproducing dependency interaction
It requires:
- snapshots or fixtures
- pinned versions
- credential scope
- time and randomness control
- idempotency
- suppression of external side effects
- reconciliation of unknown outcomes
- output comparison
Payments, email, deletion, and deployment must not happen again merely because Replay was pressed. If an external effect is unknown, reconcile with its authority before allowing a new operation.
Label the result explicitly:
recorded_reconstructioncontroller_replaysandbox_reexecutiondivergedincomplete_evidence
A similar-looking playback is not proof of determinism.
SLOs, hard invariants, and operating budgets should not share one red line
An agent system with only an availability SLO can remain online while producing incorrect and expensive work.
Calling every number an SLO also removes useful precision. Three categories are more practical.
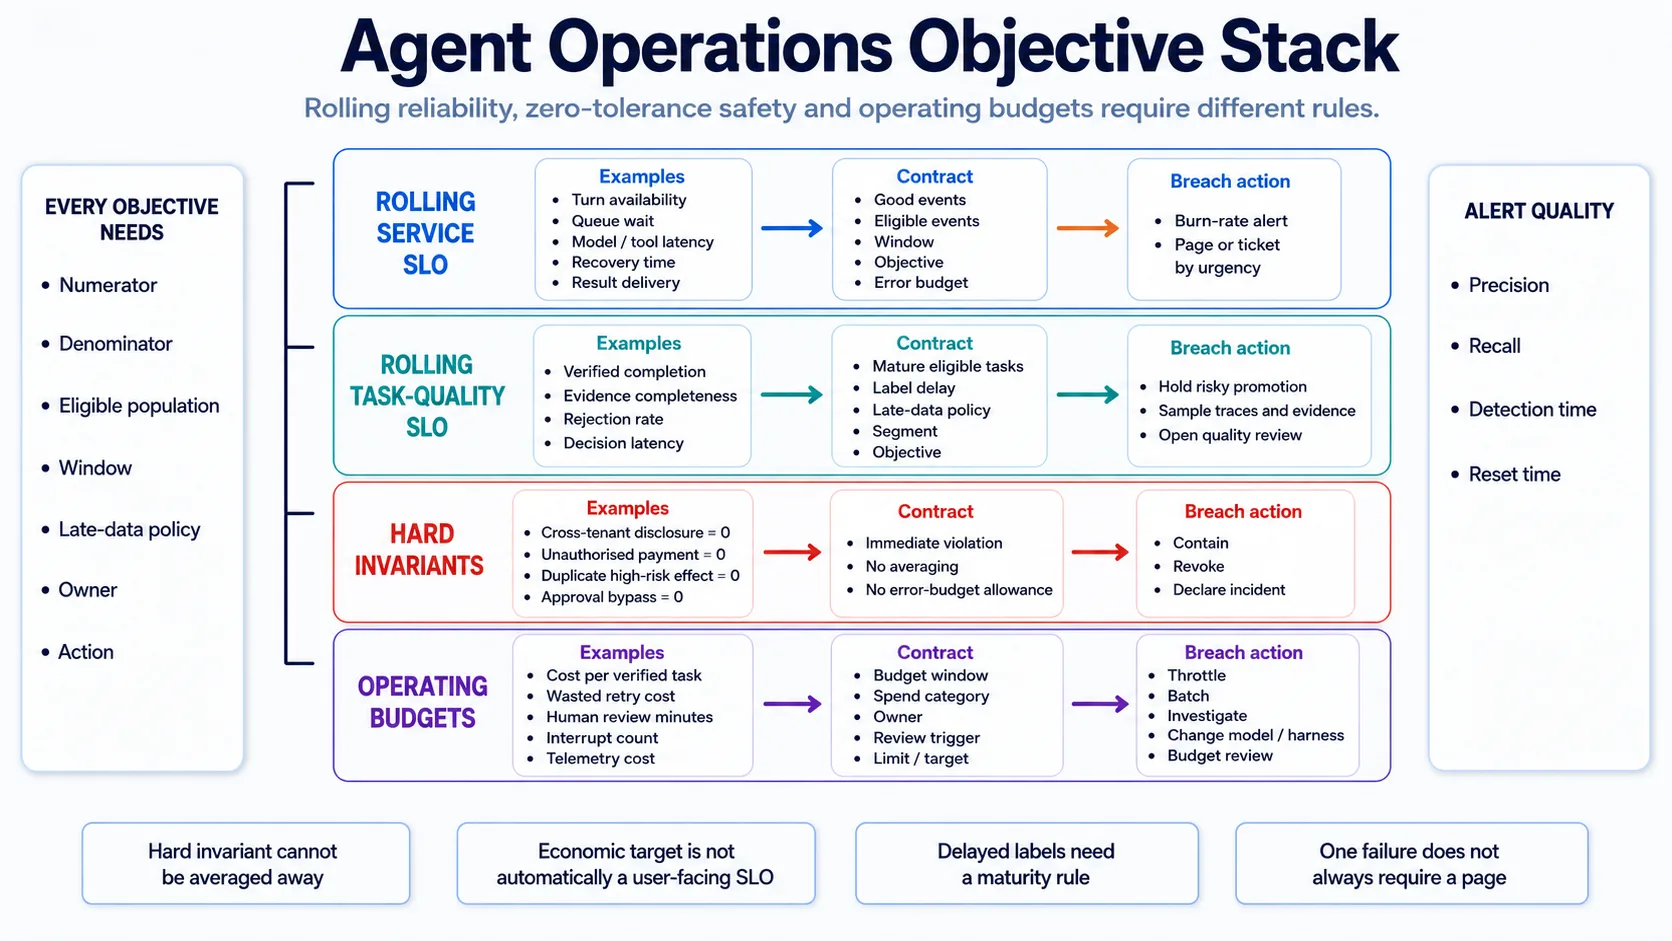
Figure 11-3 | Service and task-quality SLOs, hard invariants, and economic or attention budgets use different windows, calculations, and breach actions.
Rolling service SLO
Good-event and eligible-event definitions fit:
- turn availability
- queue wait
- model and tool latency
- recovery time
- background-result delivery
- event-pipeline availability
For example:
good terminal turns / eligible terminal turns
over 28 days
Rolling task-quality SLO
Possible measures include:
- verified-completion rate
- evidence completeness
- rejection and correction rate
- escalation rate
- completion-decision latency
Delayed labels matter. If a completion decision or human review arrives hours later, immature tasks must not be counted as failures or quietly excluded forever.
Hard invariant or zero-tolerance gate
The following usually should not be averaged into a rolling SLO:
- cross-tenant data leak
- unauthorised payment
- duplicate high-risk side effect
- approval bypass
- secret exposure
duplicate_refund = 0 is closer to a non-negotiable invariant or runtime and release gate than an error budget that may be consumed.
Economic or attention objective and budget
- cost per verified successful task
- wasted retry budget
- evaluator-cost ratio
- human-review minutes
- synchronous-interrupt count
- telemetry storage and ingestion cost
If these represent a direct user promise, they may belong in a service objective. Otherwise operating objective or budget is often clearer than forcing the term SLO.
An actionable objective contract
profile: refund-agent-production-v5
window: 28d

service_slo:
  turn_availability:
    good: terminal_turn_without_platform_failure
    eligible: production_terminal_turn
    objective: ">= 99.5%"
  queue_wait_p95:
    objective: "<= 20s"

task_quality_slo:
  verified_completion:
    good: completion_decision == passed
    eligible: mature_eligible_task
    label_delay: "24h"
    objective: ">= 96%"

hard_invariants:
  cross_tenant_disclosure: "= 0"
  duplicate_refund: "= 0"

operating_budgets:
  cost_per_verified_task_p95: "<= 1.80 USD"
  synchronous_interrupts_per_task_p95: "<= 1"

on_breach:
  service_burn:
    - page on-call
  quality_regression:
    - hold risky promotion
    - sample evidence
  hard_invariant:
    - contain
    - revoke
    - declare incident
The numbers are illustrative. Each objective needs:
- SLI or good event
- eligible population
- window
- target
- missing and late-data policy
- burn or breach rule
- owner
- action
Google SRE builds SLO alerting around error-budget consumption and evaluates alerting through precision, recall, detection time, and reset time. Agent systems can use the same principle instead of paging for every ordinary failure.89
Alerts, notifications, and human attention are different problems
Recording an event does not mean that a person should be notified. Delivering a notification does not mean that it deserves an immediate interruption.
Route events into three tiers. Routing and prioritisation should happen before a notification is created.
Immediate interrupt
Reserve this for:
- hard-invariant violation
- security incident
- imminent data loss
- policy-required approval on a critical path
- fast error-budget burn
- a high-risk unknown outcome that cannot be contained automatically
Batched review or ticket
Use this for:
- completed background work
- ordinary pull requests or research reports
- evaluator findings
- low-risk ambiguity
- slow quality regression
- budget burn that can wait until the next working period
- groups of similar escalations
Recorded only or no notification
Use this for:
- routine progress
- heartbeat
- retry within budget
- intermediate worker result
- expected cleanup
- successful automatic recovery
- repeated events already absorbed by a parent incident
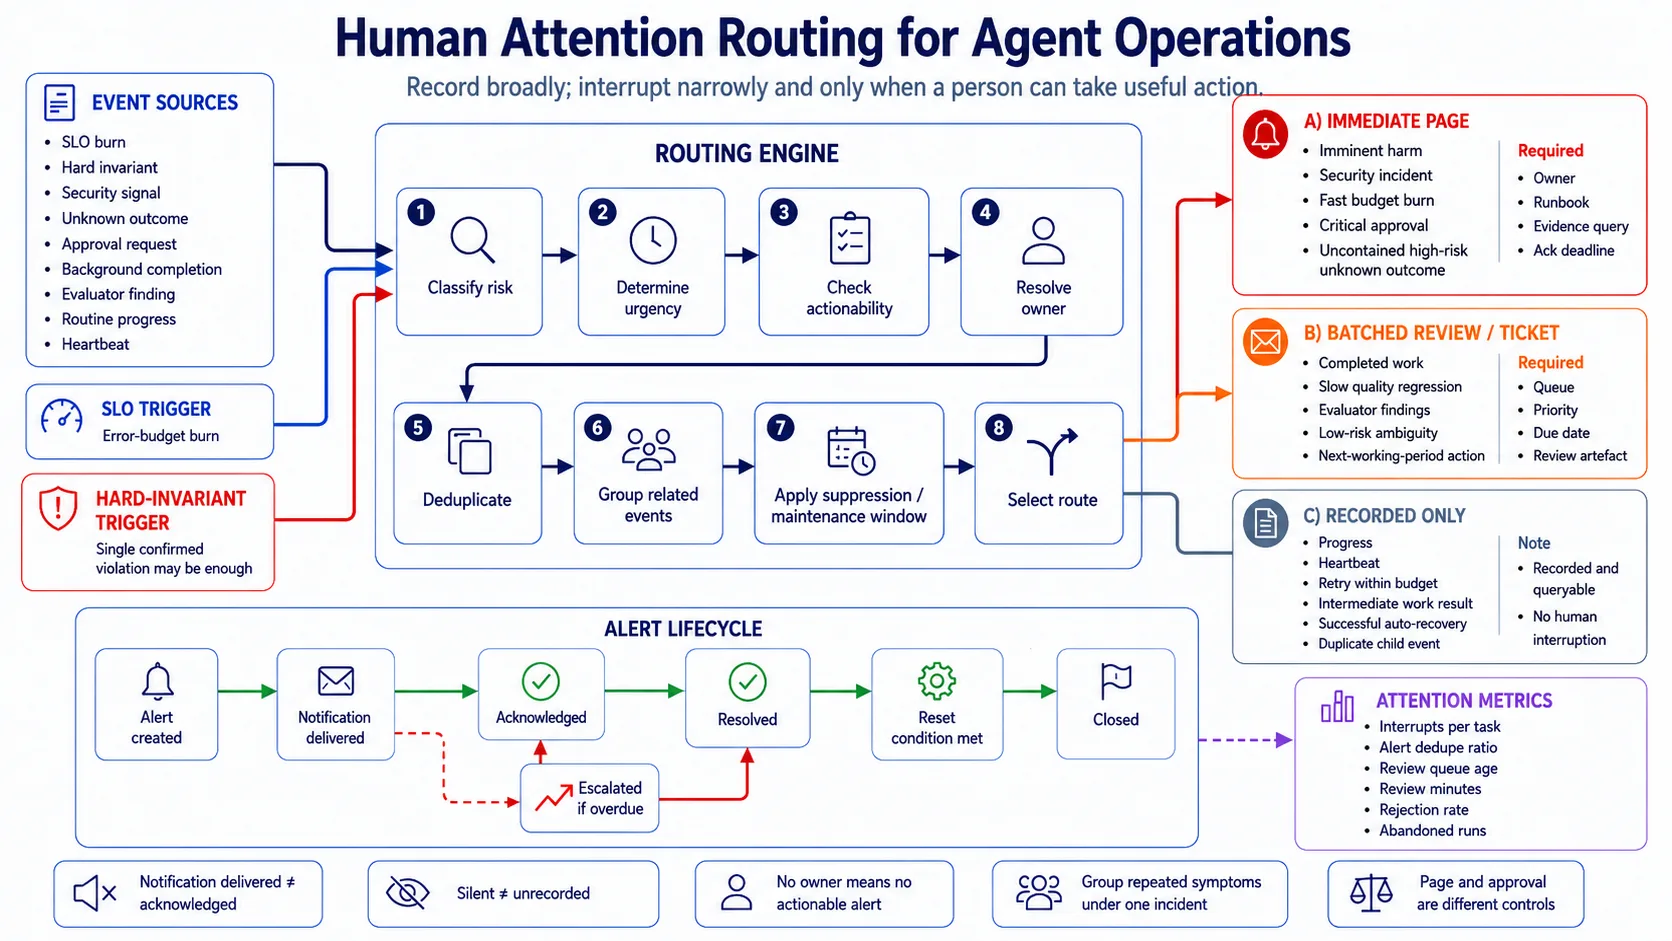
Figure 11-5 | Risk, urgency, actionability, deduplication, and ownership route events to a page, batched review or ticket, or recorded-only handling. Silent does not mean unrecorded.
An operational alert contract
It should contain:
- detection rule or SLI
- severity
- risk and blast radius
- owner and on-call route
- deduplication and grouping key
- suppression and maintenance window
- acknowledgement
- escalation deadline
- runbook link
- evidence and trace query
- resolution and reset condition
An SLO alert should normally correspond to significant error-budget burn. A security or hard-invariant event may page on one occurrence. The two classes should not share one threshold template.
Google SRE distinguishes pages, tickets, and other notifications and argues that only significant events requiring immediate human action should interrupt on-call staff.29
Human attention also needs a budget
Useful measures include:
- interrupt count
- synchronous-approval count
- alert-deduplication ratio
- review-queue size and age
- average review time
- clarification turns
- result-rejection rate
- escalation reason
- time to a natural checkpoint
- abandoned runs
Possible limits include:
- maximum synchronous interruptions per task
- event classes that must be batched
- maximum reading cost of a review artefact
- no escalation without evidence and an owner
- repeated alerts grouped instead of duplicating human anxiety
Mitchell Hashimoto’s description of background-agent work emphasises choosing a natural time to inspect results rather than allowing notifications to fragment work continuously. It is not the only valid model, but it identifies attention as a constrained runtime resource.10
Incident response must preserve control, evidence, and learning
An incident runbook should contain more than “restart the agent”.
For each important failure class, define:
- detection and declaration criteria
- severity
- incident commander, operations, communication, and subject-matter roles
- immediate containment
- kill, pause, and revoke actions
- telemetry, state, and artefact evidence freeze
- external-side-effect reconciliation
- customer and operator communication
- safe recovery
- owner and escalation path
- exit and resolution criteria
Google SRE incident guidance stresses a clear command line, defined roles, a working record, and early incident declaration. These are particularly important for agents because models, tools, policies, workers, and external side effects may all participate.11
A complete loop can be:
Detect and declare
→ establish command and communication
→ contain
→ freeze state and evidence
→ reconcile external side effects
→ restore safely
→ identify causal factors and control gaps
→ create regression and harness repair
→ verify effectiveness
→ update runbook and ownership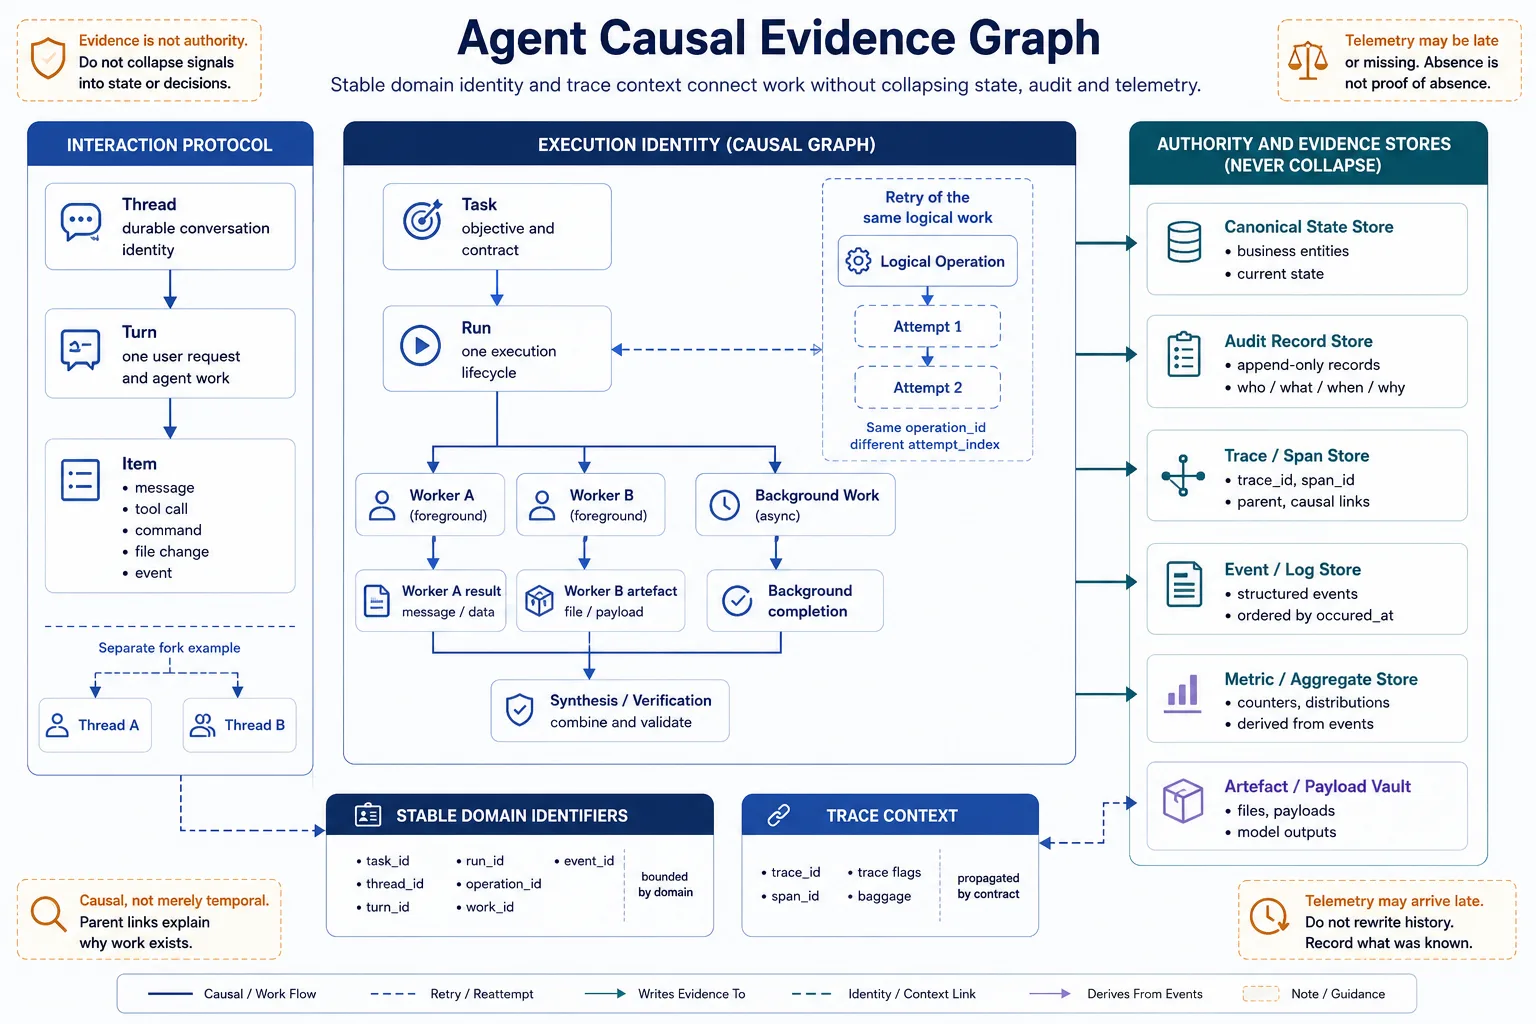
Figure 11-4 | Service restoration is not the end of an incident. Evidence preservation, causal analysis, harness repair, and effectiveness verification reduce the chance of recurrence.
Do not compress every incident into “model instability”
One incident may involve:
- a model proposing the wrong operation from ambiguous context
- a tool contract without an operation identifier
- retry policy treating an unknown outcome as an ordinary timeout
- policy missing one resource
- a verifier unable to observe external state
- an alert without an owner
- a rollout changing four versions together
- a runbook without reconciliation
Rather than forcing one root cause, record:
- trigger
- causal and contributing factors
- failed or missing controls
- detection gap
- containment gap
- recovery gap
- organisational or process factor
- corrective action
- owner and deadline
- verification evidence
Google SRE also notes that one incident may have several root causes. Repairing each factor is what creates confidence that the event will not recur in the same way.2
Incident-driven harness changes require a review gate
Observability may produce:
- candidate regression case
- diagnostic improvement
- policy or tool-contract change
- SLO or alert update
- runbook patch
- architecture constraint
An anomalous trace must not rewrite the production prompt or policy automatically. Improvements pass through triage, ownership, versioning, evaluation, and promotion.
OpenAI’s tax-agent case converted professional corrections in product traces into structured differences, grouped repeated failures, and then created evaluation targets and engineering repairs. Observability drove improvement, but data processing, evaluation, and engineering review remained in the loop.12
Version correlation enables comparison without promising magical reproduction
Each important trace should link:
- model identifier, provider, and inference profile
- SDK, API, and adapter versions
- prompt and agent-configuration digest
- context-builder and compaction policy
- tool schema, runtime, server, and capability snapshot
- policy and approval rule plus decision identifier
- retriever, reranker, and dataset snapshot
- verifier, grader, and completion-contract version
- sandbox and container image
- feature flag, deployment, and region
- budget, timeout, retry, and concurrency
- telemetry schema, convention, and instrumentation version
- redaction, sampling, and retention policy
A content-addressed run manifest may look like:
run_id: run_refund_8a1f
task_id: refund-reconcile-204
started_at: 2026-07-08T04:12:31Z
deployment: refund-prod-eu-2026.07.08.3

model:
  provider: example-provider
  id: provider/model-version
  inference_profile: balanced-v3

harness:
  agent_config: refund-agent-31
  prompt_digest: sha256:8e2f...
  context_policy: progressive-disclosure-7
  tool_catalog: payments-tools-12
  capability_snapshot: sha256:48ad...
  permission_policy: refund-policy-19
  completion_contract: refund-completion-5
  verifier: refund-release-verifier-8

runtime:
  sandbox_image: refund-worker@sha256:71b...
  retry_policy: transient-v5
  timeout_policy: production-v4
  feature_flags: sha256:19a0...

telemetry:
  internal_schema: agent-telemetry-2.0
  genai_convention_revision: otel-genai@pinned-revision
  instrumentation_version: 0.19.0
  sampling_policy: risk-tail-sampling-3
  redaction_policy: payment-restricted-6
The manifest makes changed conditions comparable. It does not guarantee that:
- model sampling is identical
- external data still retains the historical version
- unrecorded payloads can be restored
- clocks, randomness, and provider behaviour remain unchanged
- side effects can be re-executed
If a version reference has expired, mark the manifest partially_reconstructable rather than pretending recorded reconstruction remains possible.
Version correlation turns “the model has been strange lately” into testable questions:
- does the issue occur only with
tool_catalog@12 - is it isolated to one region
- did approval waiting rise after policy 19
- did instrumentation 0.19 omit an event class
- does model A regress only with the older prompt
Incident investigation needs comparable conditions, not a trace screenshot full of arrows without versions.
Walking through the refund incident
Return to the refund agent from the opening.
1. Identity and manifest are fixed
The system creates:
task_idthread_idturn_idrun_idtrace_idoperation_id
The run manifest records agent configuration, model, tool-capability snapshot, policy, completion contract, verifier, sandbox, and telemetry-convention revision.
2. Context build follows the data policy
The trace retains:
- context-source identifier
- version and freshness
- selection reason
- token count
- redaction class
The complete customer document is not placed directly in the span. A controlled artefact reference points to a short-lived payload vault.
3. The model proposes a tool operation
The span records tool name, schema version, argument digest, policy-decision identifier, and operation identifier.
A separate audit path retains:
- actor
- canonical resource
- authorisation result
- approval reference
- policy version
The critical authorisation record remains durable even if the trace is not sampled or the collector is temporarily unavailable.
4. The payment tool times out
The runtime trace reports a dependency timeout.
Canonical RunState marks the effect:
unknownrather than compressing it into ordinary failed.
An export gap is also visible: the payment-client span was created, but the external-response event did not reach the collector. That gap must not be interpreted as proof that the provider did not respond.
5. Recovery reconciles external state first
The controller queries the payment provider using operation_id.
The provider confirms that the refund was accepted, so the runtime:
- does not resend
- commits an external-receipt reference
- updates canonical state
- emits a late-result event
- classifies the timeout as response lost after acceptance
6. Worker cost and time are attributed correctly
The dashboard shows:
- end-to-end wall-clock: 48 seconds
- summed worker time: 79 seconds
- critical path: payment API plus reconciliation
- coordinator exclusive cost: low
- a research worker repeatedly loaded context and created unnecessary token cost
This is more truthful than saying that the run “took 79 seconds”.
7. The verifier blocks false completion
External state and the internal ledger are not yet consistent, so completion authority keeps the run in needs_review.
The trace records the verifier result. The completion-decision record remains the pass-state authority.
8. The alert is routed correctly
An ordinary timeout does not page by itself.
The incident condition is:
- high-risk unknown outcome
- external refund already occurred
- internal ledger not yet committed
- reconciliation deadline approaching
The alert includes an owner, runbook, trace query, operation identifier, and deduplication key.
9. The incident creates verifiable improvements
The team finds that:
- the tool-result contract lacks receipt-recovery guidance
- reconciliation spans lack a standard causal link
- payment-client instrumentation occasionally drops exports
- the runbook omits the late-result queue
Repairs include:
- updating the tool-result contract
- adding an unknown-outcome diagnostic
- creating a regression case
- repairing instrumentation
- updating alert rules and the runbook
- verifying that recurrence falls
Observability does not declare that the problem is fixed. It supplies the evidence needed for repair, verification, and operational judgement.
Twelve questions for reviewing agent observability
- Can a user outcome be traced to task, thread, turn, run, worker, operation, and evidence?
- Does the correlation model support fan-out, fan-in, retry, fork, and background completion rather than only a tree?
- Are canonical state, audit records, telemetry, and quality decisions separate?
- Do spans, events or logs, metrics, artefacts, and audit records have distinct contracts?
- Do metric labels retain bounded cardinality, with exemplars linking back to traces?
- Are sampling, redaction, and export gaps visible?
- Is sensitive content metadata-first, with a vault, access audit, retention, and regional control?
- Is replay separated into recorded reconstruction, controller replay, and sandbox re-execution?
- Are service and task-quality SLOs, hard invariants, and cost or attention budgets distinct?
- Are alerts routed by error-budget burn, risk, urgency, actionability, and ownership?
- Does incident response preserve command, evidence, external reconciliation, causal factors, and verification of corrective action?
- Can a version manifest identify the model, tool, policy, contract, sandbox, and instrumentation conditions that changed?
A polished dashboard is not enough if sampling removes approval evidence or every run_id becomes a metric label. That merely replaces unobservability with a more expensive form of unobservability.
From theory to implementation: Part 11 checklist
- Thread, turn, run, item, worker, operation, work, and event have stable identifiers with distinct responsibilities.
- Trace context and domain identity are separate;
trace_idis not a permanent business key. - Correlation supports parent relationships, causal links, fan-out, fan-in, retry, fork, and continuation.
- Canonical RunState, audit records, telemetry pipelines, and completion decisions are separate.
- Spans or traces, events or logs, metrics, artefact or payload vaults, and audit records have explicit purposes.
- Telemetry schema, GenAI convention revision, instrumentation, and internal mapping are versioned.
- Metric labels use bounded dimensions; run-level drill-down uses exemplars or trace links.
- Sampling has explicit policies for errors, unknown outcomes, high-risk work, and rare paths.
- Approvals, policy changes, external operations, and completion decisions do not depend on sampled traces for retention.
- Prompts, tool arguments, results, and retrieved content use metadata-first recording and field-level redaction.
- Sensitive payloads use controlled references, purpose-bound access, retention, region, and access audit.
- Span trees and event timelines share identity and causal links.
- Events retain
event_id, local sequence, occurred and observed time, and payload version. - Missing parents, sampling boundaries, export gaps, clock uncertainty, and redaction gaps are visible.
- Metrics define numerator, denominator, eligible population, window, late-data policy, version, and owner.
- Multi-agent attribution separates wall-clock, summed worker time, critical path, and inclusive, exclusive, and shared cost.
- Replay distinguishes recorded reconstruction, controller or mocked replay, and sandbox re-execution.
- Re-execution has fixtures, pinned versions, credential scope, idempotency, and side-effect suppression.
- Service and task-quality SLOs, hard invariants, and economic or attention budgets are separate.
- Alert contracts include owner, deduplication, grouping, suppression, acknowledgement, runbook, and reset condition.
- Immediate, batched or ticket, and recorded-only event tiers are defined; silent does not mean unrecorded.
- Incident roles, command, evidence freeze, reconciliation, communication, recovery, and exit criteria are exercised.
- Causal analysis covers model, harness, tool, policy, instrumentation, dependency, and process gaps.
- Incident repairs have owners, deadlines, regression evidence, and effectiveness verification.
- Run manifests link model, configuration, tool capability, policy, contract, verifier, sandbox, feature flag, and telemetry policy.
- Observability signals are not treated as canonical state, audit proof, quality verdict, or release authority.
Part 12 closes the series by examining which harness patterns to establish, which anti-patterns to remove, and which controls can be simplified or deleted as model capability improves.
References
Footnotes
-
OpenAI, Codex App Server, accessed 8 July 2026; and Unlocking the Codex harness: how we built the App Server, 4 February 2026. ↩
-
Rob Ewaschuk, Google SRE, Monitoring Distributed Systems. ↩ ↩2 ↩3
-
OpenTelemetry, OpenTelemetry GenAI Semantic Conventions, accessed 8 July 2026. Agent and framework conventions include Development-status surfaces and should be pinned by revision. ↩
-
OpenTelemetry, Semantic Conventions 1.43.0, accessed 8 July 2026. The core documentation notes that GenAI conventions have moved to a separate repository. ↩
-
OpenTelemetry, Deprecating the Span Events API, 17 March 2026. ↩
-
OpenAI, Tracing in the OpenAI Agents SDK, accessed 8 July 2026. ↩
-
OpenAI, Codex Advanced Configuration: OpenTelemetry metrics and events, accessed 8 July 2026. ↩
-
Chris Jones, John Wilkes and Niall Murphy, Google SRE, Service Level Objectives. ↩
-
Steven Thurgood et al., Google SRE Workbook, Alerting on SLOs. ↩ ↩2
-
Mitchell Hashimoto, My AI Adoption Journey, 5 February 2026. ↩
-
Google SRE Workbook, Incident Response. ↩
-
OpenAI, Building self-improving tax agents with Codex, 27 May 2026. ↩