When the June Forecast moves away from the January Budget
Start with a management meeting in June.
The Budget approved in January assumes TWD 78 million of full-year revenue. By June, the enterprise product is behind schedule, conversion in the second-market pipeline is weaker than expected and recruitment has moved more slowly. Finance refreshes the Forecast. The new full-year revenue view is TWD 70 million.
The natural reaction is to ask which number is right. Both may be valid.
TWD 78 million records the baseline and resource decisions approved at the start of the year. TWD 70 million records the outcome that now looks most likely after six months of actual results and changed assumptions. Management needs both views because they answer different questions.
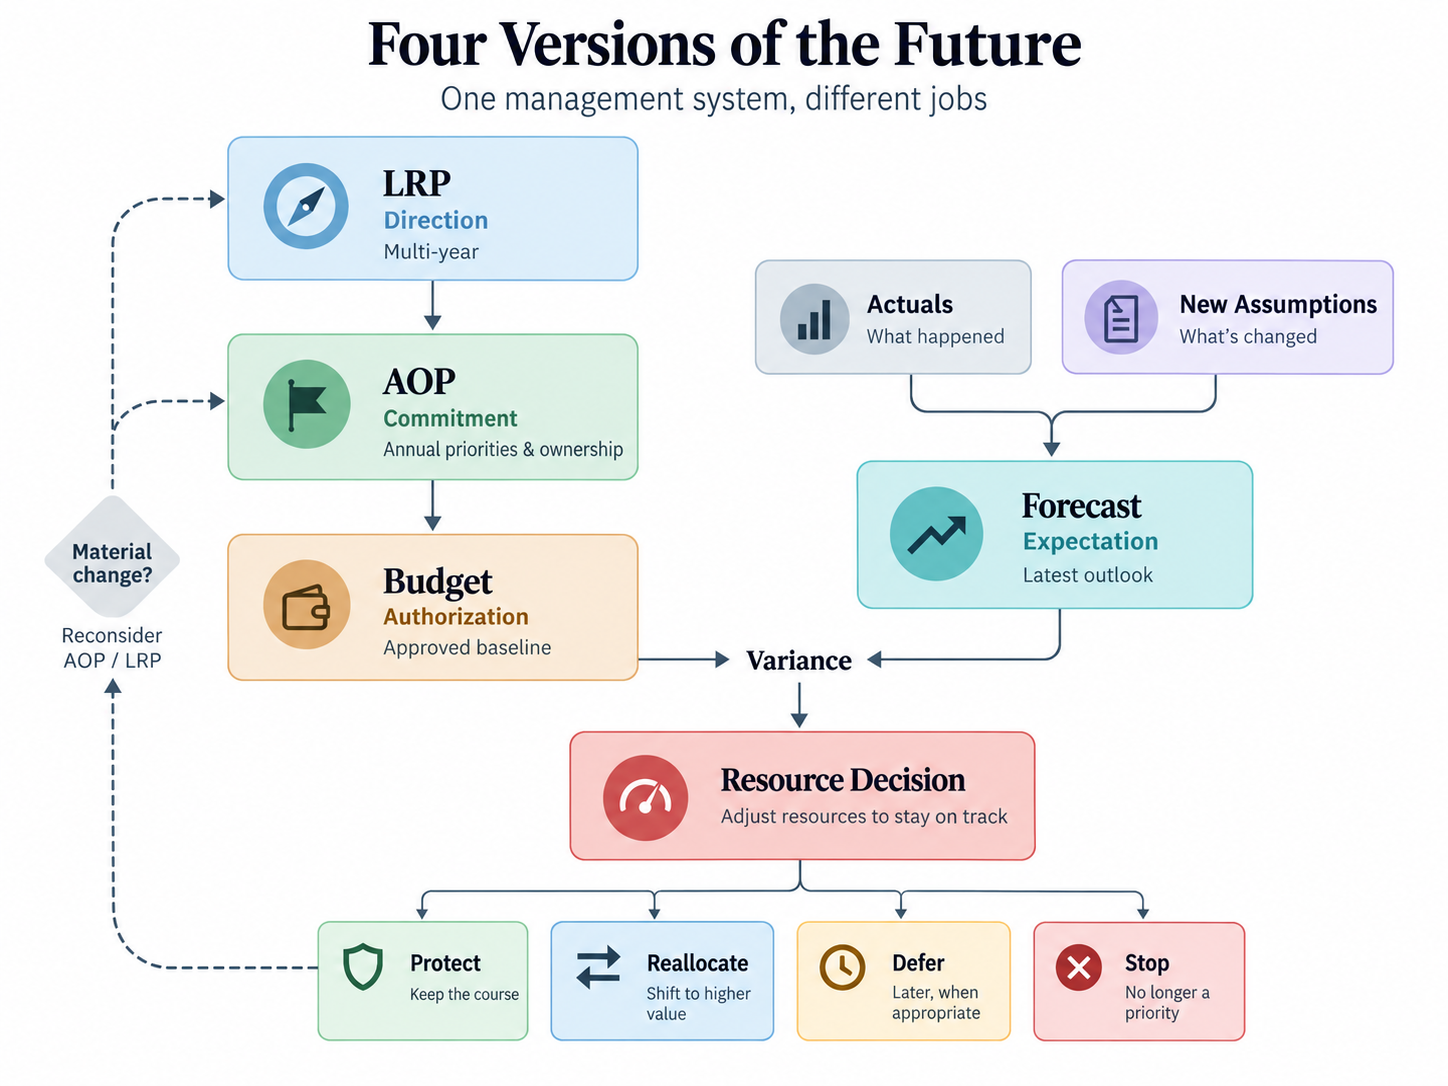
That is the organising idea behind LRP, AOP, Budget and Forecast. Each is a way of looking forwards, but each carries a different management responsibility.
Give each number one job
A planning system becomes hard to use when one artefact is expected to hold long-term strategy, this year’s operating commitments, authorised spending and the latest estimate of the outcome.
Those needs pull in different directions. A company may want to preserve the commitment made in January while updating its estimate in June. If “the Plan” has to do both, somebody eventually has to choose between rewriting history and ignoring new information.
IMA’s FP&A principles and the Government Finance Officers Association’s forecasting guidance treat planning, budgeting and forecasting as connected activities with different purposes.
For this article, one word for each role is enough:
- LRP: direction
- AOP: commitment
- Budget: authorisation
- Forecast: expectation
A company does not need four separate applications to preserve these distinctions. It does need to know whether a number expresses where it wants to go, what it intends to execute this year, what resources have been approved, or what now appears likely.
What the four planning objects control
| Planning object | Primary question | Management role | Typical horizon | What happens when reality changes? |
|---|---|---|---|---|
| LRP | Where are we trying to go? | Long-term direction and strategic-financial trajectory | Multi-year | Revisit when strategy, constraints or economics change materially |
| AOP | What must we execute this year? | Annual commitments, initiatives and ownership | Upcoming financial year | Manage execution; selectively replan if important assumptions break |
| Budget | What resources have been approved? | Financial and resource-authorisation baseline | Usually annual | Preserve the baseline unless governance formally revises it |
| Forecast | What is now most likely to happen? | Current expectation and risk/opportunity signal | Current year or rolling horizon | Update as actuals and assumptions change |
LRP. A Long-Range Plan sits above annual operating decisions. It describes the multi-year strategic and financial trajectory the company is trying to create. IMA and AFP’s material on integrated planning both connect long-range strategy with shorter-term operating and financial plans. Three to five years is common, but the useful horizon depends on the business. A capital-intensive company may need much longer; a fast-changing company may gain little from pretending year five can be forecast precisely.
AOP. The Annual Operating Plan brings the long-range direction into the coming financial year. Product milestones, market entry, sales-capacity expansion, hiring, operating priorities and named owners may all sit here. IMA describes the AOP in terms of what the organisation intends to achieve during the year and how it plans to achieve it.
Budget. The Budget translates those choices into an approved financial baseline. IMA treats Budget as the financial side of the AOP, while AFP’s budgeting guidance emphasises the detailed financial plan, resource-allocation and performance-baseline roles. Once a team says it will build sales capacity for a second market, the Budget has to specify how many roles, how much marketing spend and which other resources are authorised.
Forecast. The Forecast incorporates what has happened since the plan was approved. GFOA recommends making the assumptions, horizon and method explicit and refreshing the forecast as conditions change. A rolling forecast extends that process by adding a new future period as an earlier one closes, keeping the forward view alive; AICPA & CIMA describes the same mechanism.
This article stops at the functional distinction. Driver design, refresh cadence, forecast accuracy and bias controls belong in the later forecasting article.
One fictional company, four planning layers
Consider a fictional B2B software company. The numbers are illustrative, not an industry benchmark.
The business currently operates mainly in one market. Management wants to enter a second market over three years, grow revenue from TWD 60 million to TWD 120 million and improve profitability over time.
From three-year direction to annual commitments
The LRP describes the shape of that journey. The second market should become a new growth engine. The product needs enterprise capabilities before the new customer segment can scale. The first two years require product and sales investment. By year three, management expects the larger revenue base to absorb more of those fixed investments.
The AOP then turns year one into executable work. In this example, the enterprise product should launch in Q2, market entry is planned for Q3, the company needs additional sales capacity, 12 roles are planned across product, sales and customer success, and product, sales and operations each need clear owners.
At this point “enter a second market” has dates, ownership and dependencies. It can be managed rather than merely repeated in a strategy deck.
From approved resources to the June update
The Budget puts an approved resource baseline underneath the AOP:
| Item | Hypothetical Budget |
|---|---|
| Full-year revenue | TWD 78m |
| Operating expenditure | TWD 58m |
| New roles | 12 |
| Marketing | TWD 6m |
| Cloud, equipment and other capability investment | TWD 3m |
Those figures establish authority as well as expectation. They show what resources were approved, who may commit them and which assumptions supported the decision at the time. Quietly replacing the Budget whenever conditions move would remove that governance record.
By June, three inputs have changed. The enterprise product is two months late. Conversion in the second-market pipeline is below the January assumption. Only five of the 12 planned roles have been filled.
Finance updates the Forecast using actual results and revised assumptions:
- revenue moves to TWD 70 million from the Budget’s TWD 78 million;
- operating expenditure moves to TWD 53 million from TWD 58 million, partly because hiring is slower;
- some marketing spend moves later in the year;
- cash burn may be lower than planned, although part of that improvement reflects delayed investment and growth activity.
Lower spending, by itself, does not tell management whether performance improved. The change might reflect genuine efficiency, delayed execution or weaker demand. The model therefore needs traceability: what the number is for, which assumptions produced it, which period it covers, where the data came from and what changed since the previous version. The U.S. GAO Cost Estimating and Assessment Guide similarly emphasises purpose and scope, assumptions, data, risk analysis, documentation and updates using actual costs when building reliable estimates.
Keep the baseline and the latest view
The Budget and Forecast now disagree by TWD 8 million of revenue. That difference is useful only if neither document is forced to impersonate the other.
Suppose management refuses to let the Forecast fall below Budget. With weaker pipeline conversion and a delayed product launch, finance can still make the spreadsheet return TWD 78 million by increasing second-half conversion assumptions. The file looks compliant, but the estimate has stopped telling management what it currently believes.
The reverse mistake is to overwrite the Budget every time the Forecast changes. That erases the record of what was originally approved and makes later variance analysis harder. Management needs the baseline, the current view and an explanation of the bridge between them.
Targets and incentives add another complication. A target can be deliberately stretching. A Forecast estimates the outcome judged most likely. If people are penalised simply for reporting a lower estimate, they have an incentive to move that estimate back towards the target. The governance design therefore needs to recognise the different behavioural pressures attached to commitment numbers and estimation numbers.
A variance is a resource decision waiting to happen
Once expected revenue has moved from TWD 78 million to TWD 70 million, explaining the variance is only part of the management job. The company also has to decide whether January’s resource allocation still makes sense.
For this software company, management could slow hiring outside the second-market bottleneck, move marketing spend towards channels with stronger conversion evidence, defer non-critical cloud or equipment commitments, or keep funding the enterprise product because that capability remains central to the three-year LRP. If the long-range assumptions themselves have changed, the appropriate response may be to revisit the AOP or LRP formally.
That is the hand-off from planning to capital allocation. Under scarce resources, management compares feasible uses across costs, benefits, risks, constraints and timing before deciding what to protect, defer or stop. The Australian Department of Finance investment framework explicitly asks decision-makers to compare options, costs, benefits, risks, targets, timelines and owners. HM Treasury / IPA business-case guidance likewise includes benefits, risks, constraints and options analysis. NPV, IRR, portfolio ranking, real options and transaction analysis come later in this series.
The sequence is straightforward:
actual results and assumptions change → the Forecast moves → management diagnoses the drivers → resource uses are reconsidered → a decision follows.
A company that refreshes its Forecast every month but only revisits resources once a year can see change faster than it can act on it. McKinsey’s work on resource allocation and strategy describes the inertia that keeps resources anchored to historical patterns, while its later discussion of tying short-term decisions to long-term strategy examines the same problem from the perspective of strategic alignment.
Names vary; functions matter
LRP, AOP, Budget and Forecast are not universal labels.
Some companies combine AOP and Budget and call the package “the Budget”. The LRP may be a Strategic Plan, Strategic Financial Plan or Three-Year Plan. A younger company may have no formal AOP at all, with annual priorities, headcount planning and the financial plan held in separate systems.
The naming is workable as long as the management function remains clear. Problems appear when a Forecast is effectively a commitment that cannot fall below target, when a Budget is overwritten until the approval baseline disappears, when strategy has no connection to resource allocation, or when an AOP contains projects without owners, timing or resource dependencies.
A smaller company can therefore keep AOP and Budget in one workbook. It still needs to distinguish annual operating commitments, approved financial resources and the current expectations that will continue to change as new information arrives.
Four questions for any plan
When someone sends you a spreadsheet, deck or planning-system link and says, “This is the plan for the year”, ask four questions before worrying about the tabs:
- Which decision question does this artefact answer? Long-term direction, annual execution, resource authorisation or current expectation?
- What rights and responsibilities does the number create? Is it a target, a commitment, an approved limit or an estimate?
- Which horizon and assumptions sit underneath it? Can you trace the version, owner and data source when those assumptions change?
- When reality changes, should this number be preserved, updated or formally re-approved?
If those answers are explicit, management can tell whether a change belongs in the Forecast, requires a Budget approval, changes the AOP or forces a rethink of the long-range direction. That is the practical value of keeping four versions of the future instead of compressing them into one number.
References
- Institute of Management Accountants, Key Principles of Effective Financial Planning and Analysis
- Association for Financial Professionals, Finance Business Partnering
- Association for Financial Professionals, Budgeting
- AICPA & CIMA, Rolling Plans and Forecasts
- Government Finance Officers Association, Financial Forecasting in the Budget Preparation Process
- U.S. Government Accountability Office, Cost Estimating and Assessment Guide
- Australian Department of Finance, Commonwealth Investment Framework RMG 308, Part 1
- HM Treasury / Infrastructure and Projects Authority, Guide to Developing the Project Business Case
- McKinsey & Company, How to Put Your Money Where Your Strategy Is
- McKinsey & Company, Tying Short-Term Decisions to Long-Term Strategy