A moat is a causal claim about competition. That is what makes it harder to establish than the usual shorthand suggests.
Market share, retention, user growth and higher prices all deserve attention, but each can be produced by more than one mechanism. Customers can stay because switching is painful or because the product is simply better. A marketplace can grow because participation improves the service or because subsidies are buying activity. A company can lift a headline price while discounting more heavily elsewhere.
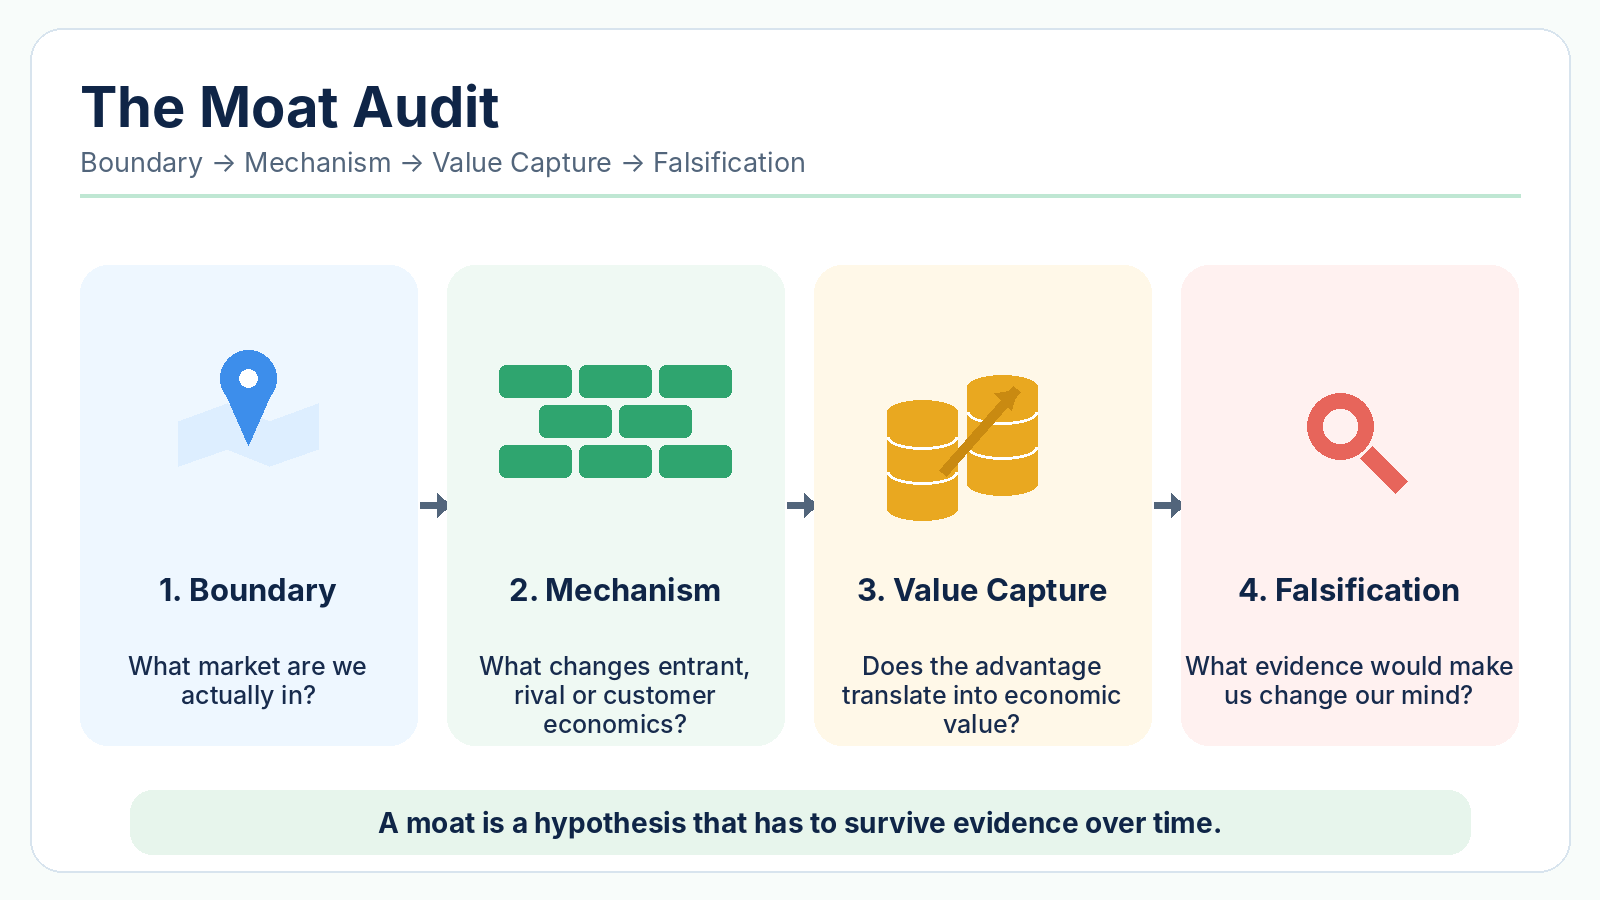
The practical test used here has four parts: Boundary → Mechanism → Value Capture → Falsification. A defensible moat needs a sensible competitive boundary, a mechanism that changes rivals’ or customers’ economics, evidence that some of the resulting value is actually captured, and a condition that would make us revise the claim.
Start with the uncomfortable numbers
Take a hypothetical two-sided marketplace with the following operating picture:
| Metric | Change |
|---|---|
| Active buyers | +40% |
| Active sellers | +30% |
| Published take rate | 12% → 13% |
| Repeat-purchase rate | 78% |
| Incentives / subsidies | +50% |
| Contribution margin | 18% → 11% |
| Top-seller multi-homing rate | 70% |
The optimistic interpretation is easy to construct. Both sides are expanding, repeat purchase is high and the published take rate has moved up. A slide deck could turn that into three claims within minutes: network effects, lock-in and pricing power.
The rest of the table makes those claims harder. Subsidies have risen by 50%, contribution margin has fallen from 18% to 11%, and 70% of top sellers maintain a presence elsewhere. The data establish growth in activity. They do not identify the source of that growth or show that the platform is retaining more of the value it creates.
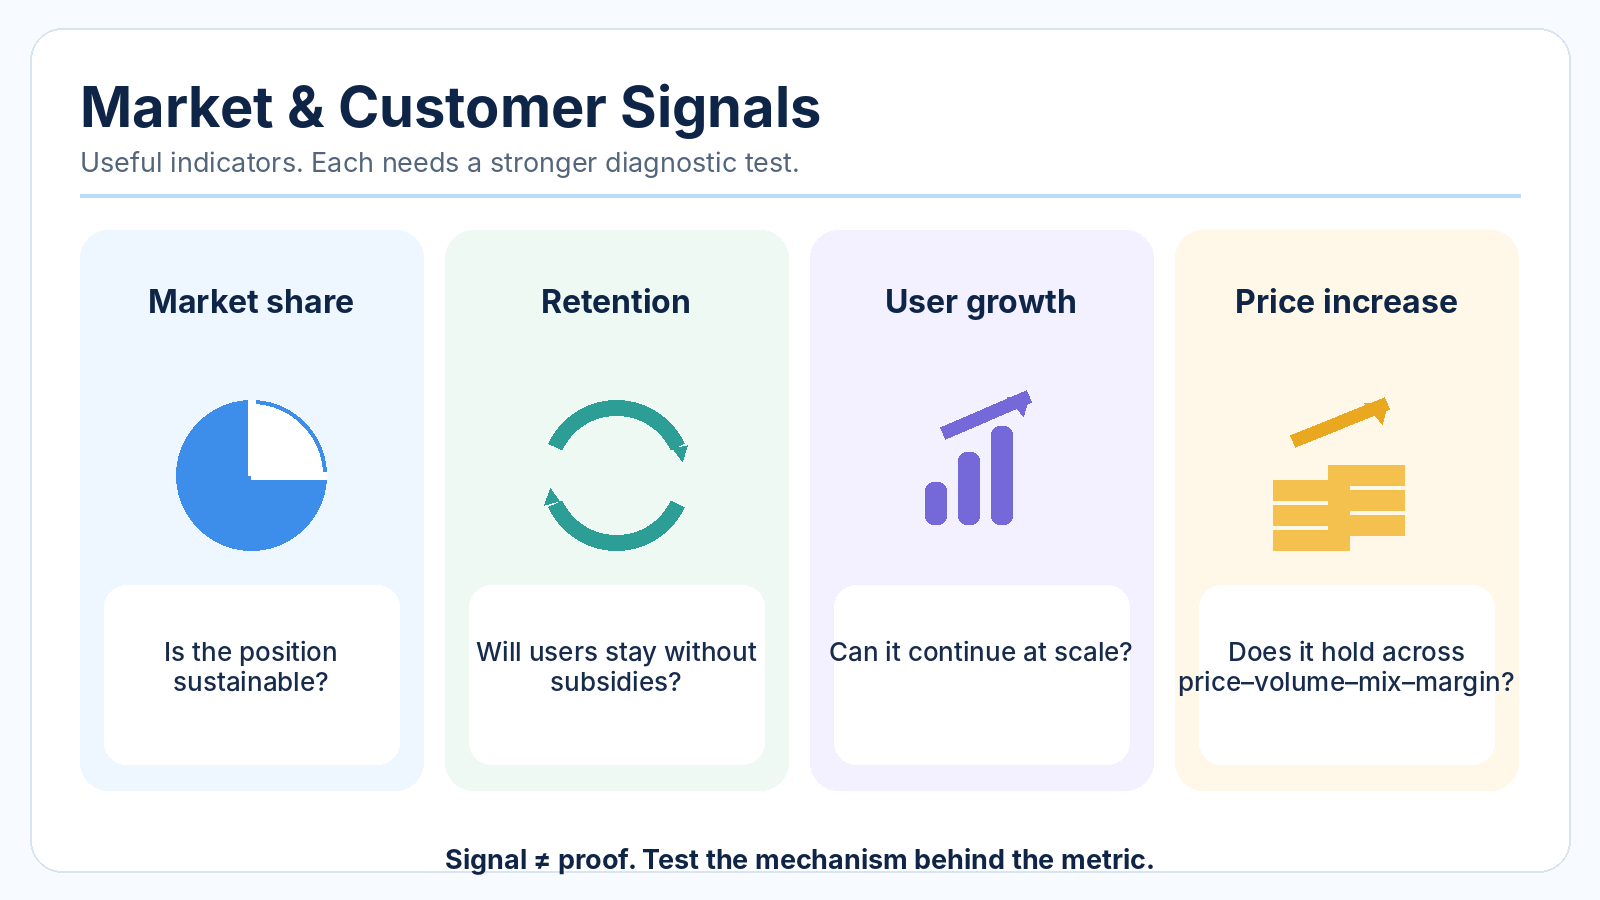
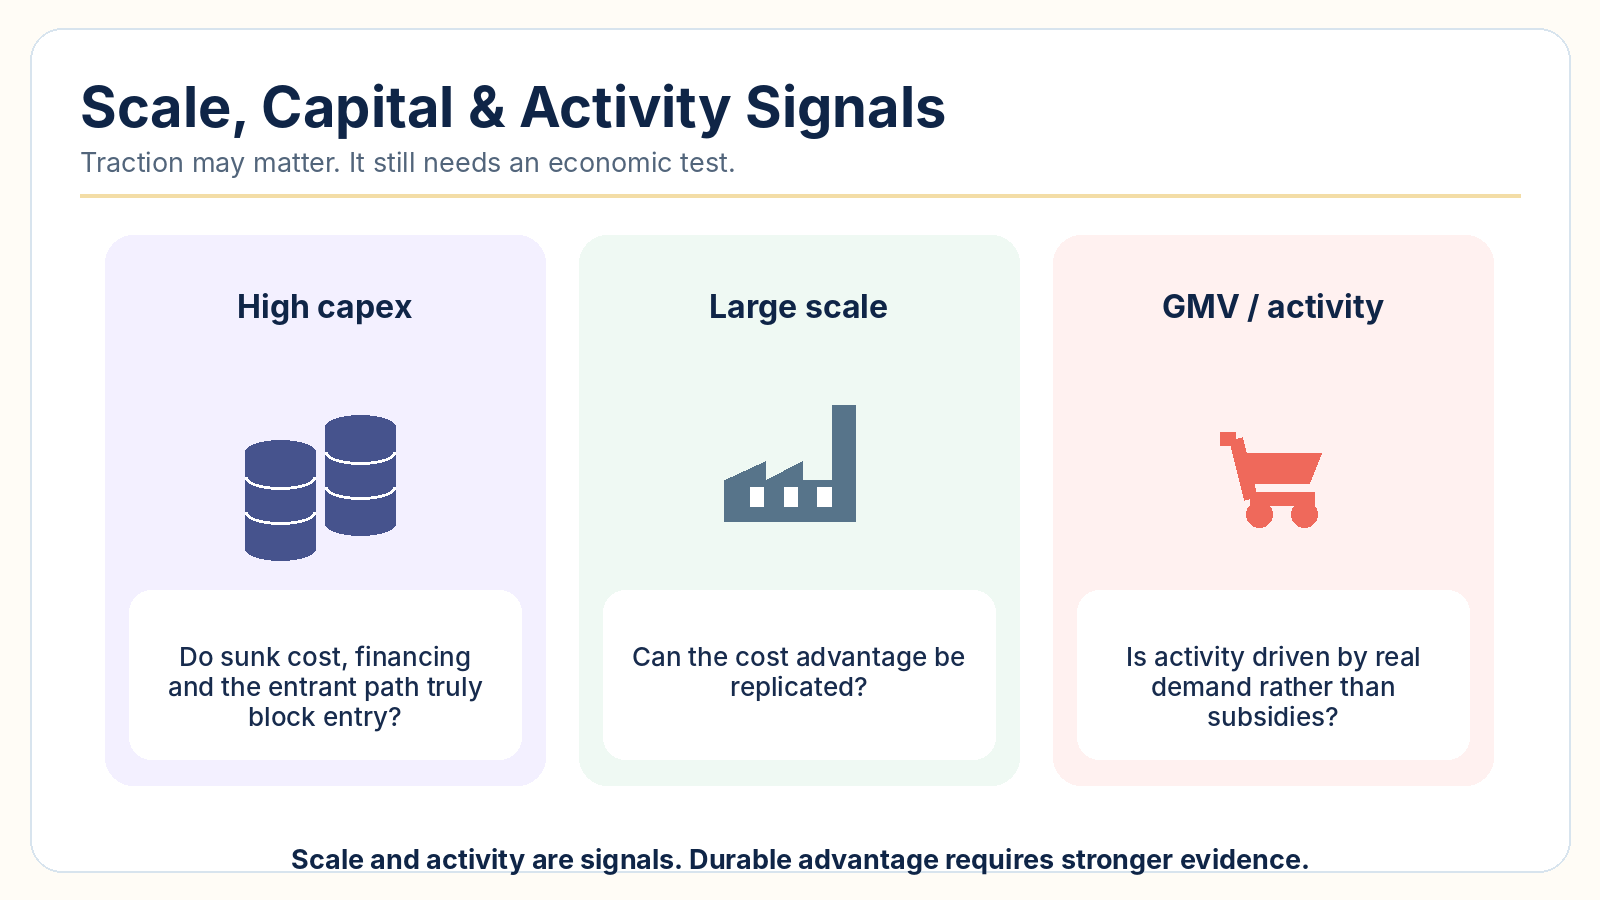
A few distinctions help keep the investigation honest. High share requires a defensible market definition before it says much about entry. Retention should lead to a switching-cost investigation, not directly to lock-in. User growth needs a directional network mechanism. A price increase needs a bridge to realised price, volume, churn, mix and margin. Capex and scale matter only once we understand what a new entrant actually has to reproduce. GMV tells us that transactions are happening; it does not tell us who captures the economics.
That is the purpose of the audit: turn attractive operating signals into questions that can be tested.
Define the arena before measuring strength
Market share is only as informative as its denominator. A specialist marketplace may dominate a narrowly named category and still face strong constraints from direct-to-consumer sites, social commerce, offline channels or other ways for sellers to acquire demand.
The European Commission’s 2024 relevant-market notice frames market definition around effective competitive constraints. The exercise is meant to identify alternatives that meaningfully constrain a firm, rather than to produce a convenient label for calculating share. (European Commission, 2024)
For the hypothetical marketplace, the boundary therefore has to cover the product or service need, the relevant customer segment, geography, time horizon and credible substitutes on both sides. If sellers can move demand generation to their own sites or advertising, and buyers can transact through other channels, those routes belong in the competitive picture when they constrain the platform’s choices.
Until that is resolved, a large share can be real and still be analytically misleading. It may describe dominance inside a category that competitors and customers do not experience as the full market.
Follow the entrant’s cheapest credible path
Incumbent expenditure is a poor proxy for the minimum cost of entry. The useful question is what a rational challenger would have to build, buy or subsidise today.
A challenger might begin with one city, one category or one customer niche. It may lease assets rather than own them, finance capacity, enter with a different distribution model or reach viable economics well below the incumbent’s current scale. What matters is the obstacle on that path: sunk investment, access to distribution, supply density, trust, licensing, customer acquisition, or some combination of them.
OECD work on barriers to entry separates sunk costs, scale and scope economies, distribution constraints and legal barriers. The U.S. DOJ and FTC’s 2023 Merger Guidelines likewise identify mechanisms such as switching costs, scale and network effects that can impede entry or expansion. (OECD, 2006; DOJ & FTC, 2023)
Minimum efficient scale is particularly important here. An incumbent can be very large without forcing every viable rival to match that size. The cost curve, technology, demand density and total market capacity determine the scale required for an entrant to compete. Classic work on scale barriers makes the same distinction: scale economies can matter without automatically creating an insurmountable barrier. (Schmalensee, 1981; Gupta, 1981)
Nothing in buyers +40% or sellers +30% tells us that story. We would need evidence about the investment required to establish minimum viable supply and demand density, what portion of that investment is unrecoverable, and whether a smaller or differently positioned entrant has a credible route in.
Read retention alongside outside options
The marketplace reports a 78% repeat-purchase rate. On its own, that is a healthy usage signal. The more revealing companion metric is that 70% of top sellers multi-home.
Sellers can value a platform highly while keeping competing channels active. Multi-homing may itself be costly, so the 70% figure does not establish frictionless switching. It does show that many important sellers retain credible outside options, which makes a strong seller lock-in claim harder to sustain.
A proper switching-cost review would look for friction in several places: contractual commitments and lost discounts; migration time and implementation work; staff learning; APIs and embedded integrations; data portability; dependence on complements and partners; and the search or coordination cost of rebuilding counterparties elsewhere.
The UK’s Competition and Markets Authority uses this more granular approach in its work on mobile ecosystems and cloud services, examining factors such as perceived hassle, time, learning, compatibility, data and commercial commitments. (CMA, 2022; CMA, Cloud services investigation) Portability and compatibility matter precisely because they alter the practical cost of moving and the competitive pressure between platforms. (Jeon, Menicucci & Nasr, 2023)
For this case, the evidence supports strong repeat use. It does not yet support strong seller lock-in.
Trace the network effect in both directions
A platform with more participants may become more valuable, but “more users” is too coarse a unit for the analysis. The causal path needs to be visible.
Suppose seller count rises by 30%. Buyers could gain better assortment, availability and match probability. Existing sellers, however, could face more rivalry for the same pool of demand. Now take buyers +40%: sellers may receive denser orders and better unit economics, but the interpretation changes if those buyers remain active only because incentives keep rising.
This is why a network-effect test should specify the direction of the effect, the unit of value and the negative externality that could offset it. Recent research distinguishes positive, negative and amplified network externalities across platform sides. (Karhu et al., 2024) Congestion research adds a useful warning: participation can eventually generate crowding or rivalry that erodes some of the benefit. (Katsamakas & Sanchez-Cartas, 2025)
For the marketplace, four observations would move the claim forward: whether more sellers improve buyer search quality and conversion; whether more buyers improve seller order density and unit economics; whether both sides remain active after subsidies are reduced; and whether seller multi-homing declines as the network develops.
The network-effect hypothesis is plausible here. The current growth rates do not yet tell us whether the loop is self-reinforcing, subsidy-dependent, or partly offset by negative effects.
Pricing power has to survive the economic bridge
The published take rate has increased from 12% to 13%. That is worth investigating, but it sits next to a 50% increase in incentives and a fall in contribution margin from 18% to 11%.
The bridge I would want to reconcile is:
Activity / users / transactions → realised price → volume / churn / migration → mix / incentives / cost-to-serve → contribution / operating economics
Pricing guidance itself puts pricing decisions in the context of the offer, customers and competition. (Northern Ireland Business Info) Demand response also depends on the time horizon; elasticity should not be treated as a timeless constant. (Karlan & Zinman, 2013)
So after a nominal price or take-rate increase, the relevant questions are practical ones. How much did realised net price change? What happened to volume and migration? Did customer or product mix shift? Were discounts or subsidies used more heavily? Where did contribution margin end up?
We do not have the causal bridge needed to explain the hypothetical marketplace’s movements. It would therefore be equally premature to declare that pricing power is absent. What the evidence does rule out is using 12% → 13% by itself as proof of stronger value capture.
The same discipline applies to GMV, transaction volume, market share and revenue growth. A business can create substantial value while competitors, suppliers, customers or subsidy recipients capture much of it. Brandenburger and Stuart’s value-based strategy framework makes the distinction between value creation and value capture explicit. (Brandenburger & Stuart, 1996)
Operating leverage belongs in the economic interpretation rather than the moat mechanism. A high fixed-cost base can magnify profit improvement as revenue rises and magnify losses when activity falls; it does not itself prevent entry or switching. (Dudycz et al., 2024)
What the audit says about this marketplace
The five gates do not all have the same evidential status.
Boundary. We lack a defensible map of buyer and seller substitutes and therefore lack meaningful share data inside that boundary. This gate is unresolved because evidence is missing.
Entry. Growth on both sides says nothing about entrant sunk cost, minimum efficient scale or the cost of establishing viable supply-demand density. An entry barrier has not been demonstrated.
Switching. Repeat purchase is 78%, but top-seller multi-homing is 70%. The product may be valuable; strong seller lock-in has not been demonstrated.
Network. Buyers +40% and sellers +30% make a cross-side network effect plausible. We still need unit-value evidence and behaviour after subsidies are normalised. The hypothesis remains unproven.
Value capture. Take rate 12% → 13% is accompanied by incentives / subsidies +50% and contribution margin 18% → 11%. Without the realised-price, volume, mix, subsidy and cost-to-serve bridge, pricing power and stronger value capture have not been demonstrated.
Taken together, the marketplace clearly has scale and activity growth, and there is a plausible network-effect hypothesis. The supplied evidence is not yet sufficient to establish a durable moat. Entry barriers, seller switching costs and pricing power still require mechanism-level and economic evidence. The subsidy and margin pattern raises the evidential bar for value capture in particular.
That is a provisional judgement, not a negative one. It tells us exactly what evidence should be collected next.
Write down what would change your mind
A moat becomes analytically useful when it can weaken as well as strengthen.
Consider entry. If a niche challenger reaches viable economics at far smaller scale than expected, the minimum-efficient-scale story needs revision. For switching, better interoperability or data portability may reduce migration friction, while persistently high multi-homing preserves outside options. For network effects, congestion, spam or deteriorating seller economics can turn participation growth into a mixed signal. A platform that requires continually rising subsidies to maintain activity also has a different network story from one that retains both sides after incentives normalise.
Technology, distribution and regulation can move these boundaries too. A new route to customers may remove an access constraint; licensing changes can alter contestability. Pricing power has an equally concrete warning sign: nominal prices can keep rising while realised price, retention or margin deteriorate.
I would therefore record a moat claim in four fields rather than as a permanent label:
- Boundary: the competitive arena and credible substitutes.
- Mechanism: the reason entry, expansion or switching becomes difficult or uneconomic.
- Capture: the realised price, volume, margin, bargaining position or other economic outcome in which the advantage appears.
- Falsifier: the observation that would force the claim to be marked down.
A company can be large, sticky, popular and capable of raising prices without every one of those outcomes being caused by a moat. The audit is the work of connecting the outcome to the mechanism, the mechanism to captured economics, and the claim to the evidence that could eventually overturn it.
References
- European Commission. Commission Notice on the definition of the relevant market for the purposes of Union competition law, 2024.
- U.S. Department of Justice & Federal Trade Commission. 2023 Merger Guidelines, 2023.
- OECD Competition Committee. Barriers to Entry, 2006.
- Schmalensee, R. Economies of Scale and Barriers to Entry, Journal of Political Economy, 1981.
- Gupta, V. K. Minimum Efficient Scale as a Determinant of Concentration: A Reappraisal, 1981.
- UK Competition and Markets Authority. Mobile Ecosystems Market Study: Appendix D — Barriers to switching, 2022.
- UK Competition and Markets Authority. Cloud services market investigation, 2025.
- Jeon, J., Menicucci, D. & Nasr, N. Compatibility Choices, Switching Costs, and Data Portability, 2023.
- Karhu, K. et al. Positive, Negative, and Amplified Network Externalities in Platform Markets, 2024.
- Katsamakas, E. & Sanchez-Cartas, J. M. Congestion, network effects and platform competition, 2025.
- Brandenburger, A. & Stuart, H. Value-based Business Strategy, 1996.
- Karlan, D. & Zinman, J. Long-run price elasticities of demand from randomized interest rates, 2013.
- Northern Ireland Business Info. Cost-plus versus value-based pricing, 2025.
- Dudycz et al. Operating leverage: critical analysis of definitions and measurement, 2024.