A finance team can reconcile every headline number in a quarter and still have no satisfactory explanation for what changed.
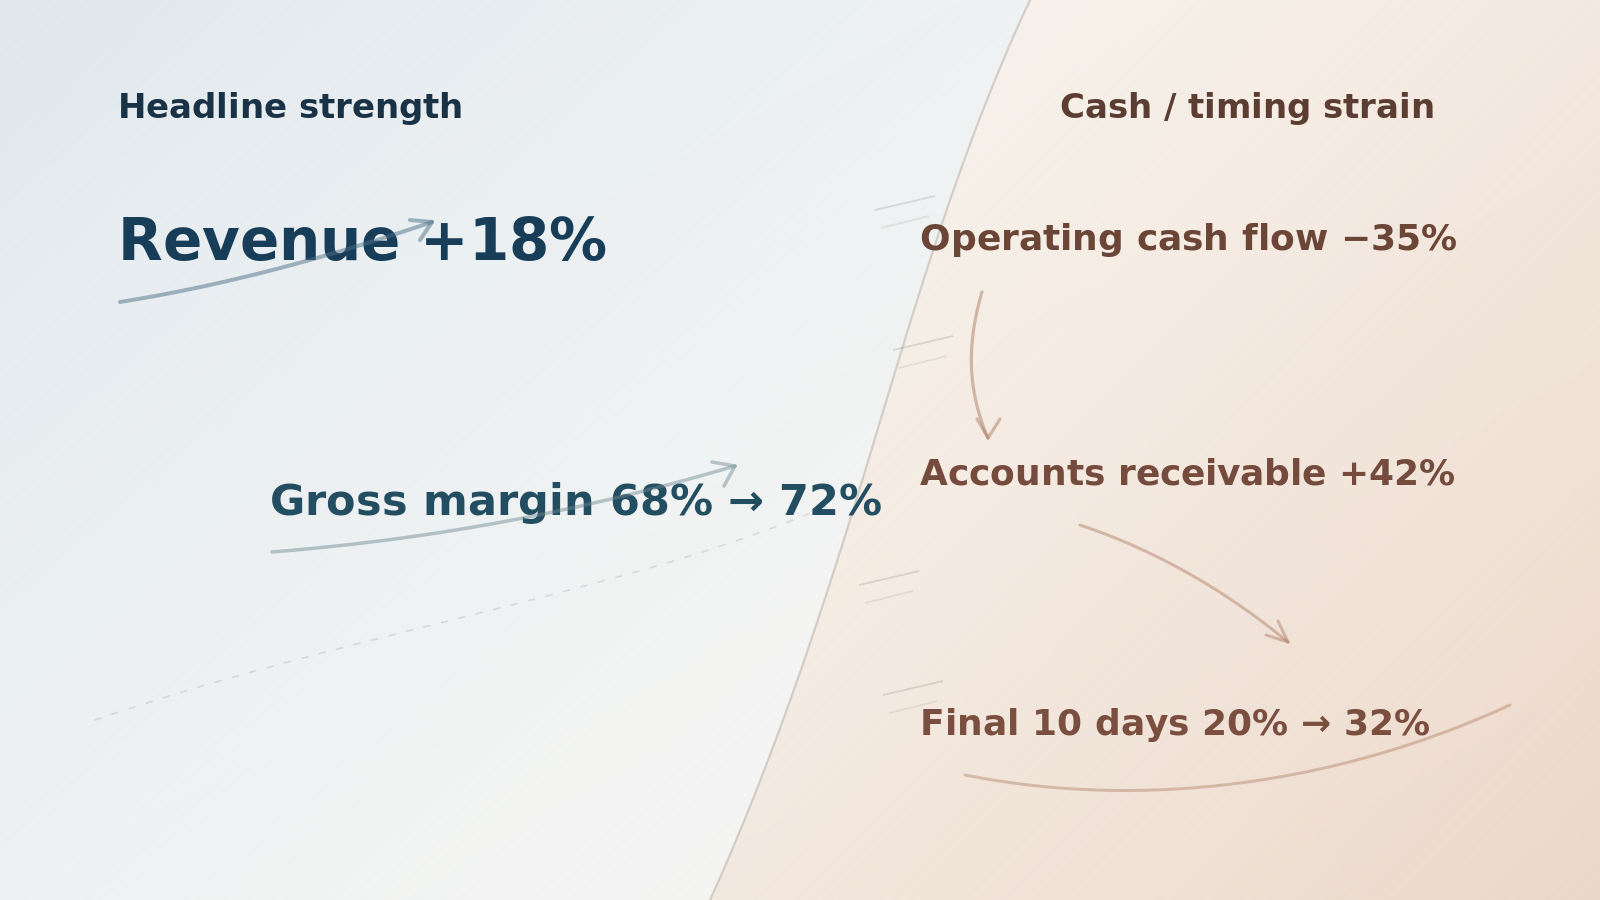
Consider a synthetic case. Revenue is up 18% year on year, gross margin has risen from 68% to 72%, operating cash flow is down 35%, and accounts receivable is up 42%. Revenue recorded in the final ten days of the quarter represents 32% of the total, compared with roughly 20% in a typical period. None of those figures refers to a real company.
At first glance, the pattern is easy to overread. Stronger enterprise mix, slower collections, a small acquisition, a cost reclassification and several large contracts closing near quarter end could all produce parts of it. Recognition timing or control activity could also deserve attention. The diagnostic task is to keep those possibilities separate long enough for evidence to distinguish them.
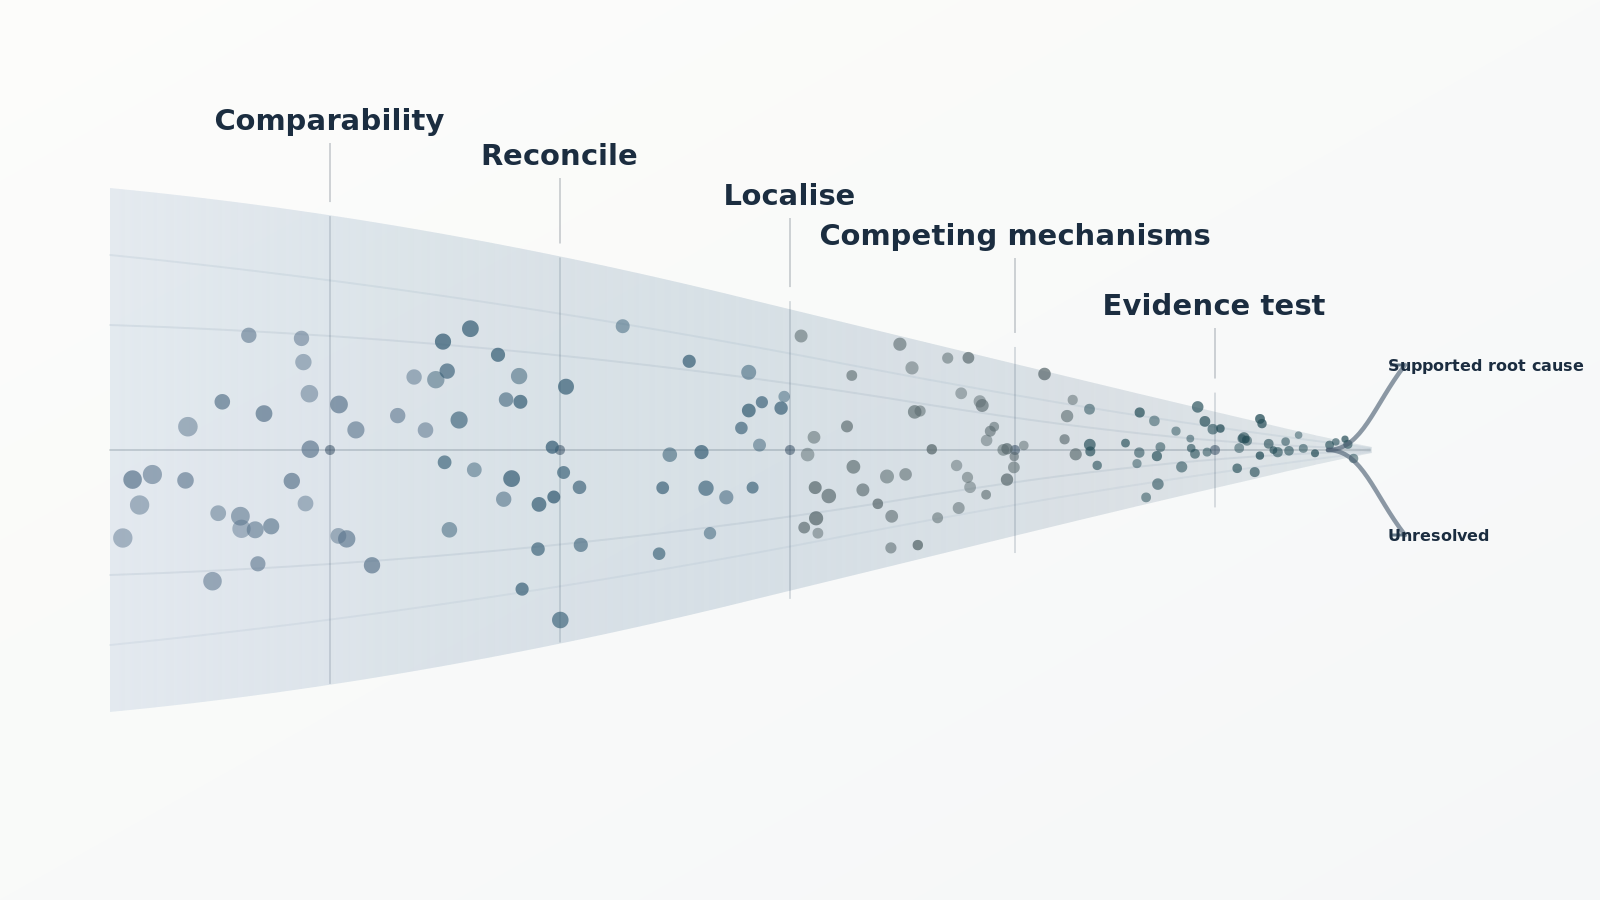
That means treating a financial anomaly as a sequence of evidence problems. First decide whether the periods are actually comparable. Then reconcile the movement. After that, locate where the unusual pattern sits, test competing mechanisms, and leave any branch open when the evidence remains incomplete.
Make the Periods Comparable Before Explaining Them
Start with the synthetic company’s two known boundary changes: it completed a small acquisition, and some hosting costs moved from cost of sales to operating expense. The first changes the reporting perimeter. The second can lift reported gross margin without an equivalent improvement in underlying unit economics.
Those two facts are enough to make a clean-looking year-on-year comparison unsafe unless the team normalises the basis first. The preflight should cover the following questions:
| Check | Question |
|---|---|
| Metric definition | Do “revenue”, “gross margin”, “customer” and “order” mean the same thing in both periods? |
| Entity / scope | Did an acquisition, geography, product transfer or internal reorganisation change the perimeter? |
| Period / timing | Are period length, seasonality, working days and cut-off comparable? |
| Currency | Is reported growth materially different from constant-currency growth? |
| Recognition basis | Did contract terms, acceptance, returns or recognition mechanics change? |
| Policy / estimate / classification | Did a policy, estimate, reserve, cost classification or presentation change? |
| Data quality | Can detail reconcile to ledgers and source systems without unexplained duplicates, omissions or late adjustments? |
The result should be a reproducible comparison pack: acquisition scope separated, currency effects identified, classification changes documented, and data-quality exceptions made visible. What remains after those adjustments is the economic movement worth diagnosing.
Materiality belongs in the same preflight because importance depends on more than size. SEC Staff Accounting Bulletin No. 99 explains that qualitative circumstances also matter. A relatively small item can therefore warrant attention if it changes a trend, affects a covenant, masks a loss or alters a decision-critical KPI.
Use the Bridges to Find Cross-Statement Tension
The revenue bridge is easiest to read first. Suppose revenue moves from 100 to 118 and the increase decomposes as follows:
- existing customer usage: +6
- pricing: +3
- product and customer mix: +4
- acquired scope: +3
- foreign exchange: +2
The bridge closes, so the arithmetic attribution is accounted for. That is useful, but the case becomes more interesting only when the other statements are brought alongside it. Gross margin has moved from 68% to 72%, with possible contributors including price, product mix, input or hosting cost, accounting classification and other defined items. Operating cash flow has weakened, potentially through receivables, inventory, payables, deferred balances, tax and other working-capital movements.
Now the questions are cross-bridge questions. If a large share of revenue growth sits with enterprise customers while receivables are consuming cash, the team can ask whether those customers received longer payment terms, whether later collections arrived as expected, whether a few large contracts dominate the period, and whether recognition timing differs from the historical pattern.
This is also where an audit-derived discipline can be useful without turning the management review into an audit. PCAOB AS 2305, Substantive Analytical Procedures requires auditors to investigate significant unexpected differences and, when appropriate, corroborate management explanations with other evidence. In the management setting here, the takeaway is narrower: a bridge can narrow the field, while supporting records determine which explanation remains viable.
Let Concentration Tell You Where to Look Next
The synthetic case becomes much more specific after disaggregation. Nearly half of the 18% revenue growth came from three enterprise customers, and most of the increase in receivables sits with the same three. Revenue recorded in the final ten days rose from roughly 20% to 32% of the quarter. One major customer moved to longer payment terms. Post-period credit notes exist, but remain within the company’s historical range.
Those facts carry different evidentiary weight. The longer payment terms already offer a conventional explanation for part of the cash divergence. The quarter-end concentration deserves closer inspection because it has changed materially from the historical pattern. The credit notes are less informative on their own because they still sit inside the company’s normal range.
The next request for evidence can therefore be narrow: contract terms, delivery or service completion, acceptance, subsequent cash, credit activity and any unusual period-end entries connected to the concentrated transactions. That is a forensic orientation in the practical sense of following the pattern into the records that can explain it.
PCAOB AS 2401, in the audit context of fraud risk, directs attention to revenue-recognition risk, journal entries, significant unusual transactions and period-end activity. Those procedures are not a statutory checklist for ordinary management analysis. They are relevant here because they identify evidence locations that can become useful once the pattern warrants escalation.
Seasonality, fast growth, product launches, acquisitions and one-off projects can all create false positives. The purpose of the red flag is therefore to change investigation priority before the team commits to an answer.
Keep Several Mechanisms Alive Until the Evidence Separates Them
By this point, the quarter has one visible pattern but several plausible mechanisms. The most useful way to organise them is by the traces each should leave behind if it is true.
| Mechanism family | Example explanation | Predicted trace | Evidence that would weaken it |
|---|---|---|---|
| Operating economics | price, mix or customer structure genuinely improved | segment and product data reproduce the revenue and margin bridge | detailed data fail to explain the improvement |
| Timing / working capital | large customers pay more slowly while recognition remains supportable | ageing, terms and subsequent cash explain receivables and cash divergence | terms are unchanged, ageing deteriorates and collections remain weak |
| Contract terms | a few large contracts completed near period end | contract, delivery, acceptance and payment terms support the timing | terms or acceptance evidence do not support the recorded timing |
| Estimate / classification | reserve, estimate or presentation change lifts a reported metric | policy and balance movements explain the reporting change | no relevant change exists or balance movements contradict it |
| Recognition / cut-off risk | some revenue may have been recognised too early or without enough support | period-end sales, receivables, returns, credits or acceptance evidence align with the concern | delivery, acceptance, contract and cash evidence support the original recognition |
| Control / override risk | non-standard entries or process bypass affect period-end numbers | unusual user, timing, approval or business-purpose patterns appear | entries are routine, approved, documented and economically consistent |
This mechanism table is deliberately competitive. Longer payment terms should produce a different ageing and collection pattern from unsupported cut-off. A classification change should show up in policy documentation and balance movements; customer acceptance evidence belongs to a different mechanism. A control-override concern should leave a different trail again, through users, approvals, timing and business purpose.
Driver trees and hypothesis structures, covered earlier in this series, are useful scaffolding for that competition. Here the unit of work is more concrete: one financial mechanism, the evidence it predicts, and the observation that would make the mechanism weaker.
Bring in DuPont, Peers or Financial Fingerprints Only When Needed
Secondary lenses earn their place only when they redirect the investigation. DuPont analysis, peer benchmarking and financial-statement fingerprints can all do that under the right conditions.
DuPont analysis can show whether a return movement is concentrated in margin, asset efficiency or leverage. Peer comparison can show whether a receivables or working-capital pattern is genuinely unusual, provided the peer set matches the business model, growth stage and reporting boundary. Both can be misleading when sector economics, capital structure, seasonality or company maturity differ materially.
A financial-statement fingerprint works one step earlier. High deferred revenue, low inventory, heavy capital expenditure or a long receivables cycle can suggest how the business model behaves and therefore which hypotheses deserve attention. It is more useful as a question generator than as a mechanism detector.
In this case, a secondary lens is worth keeping only if it changes the evidence request from a generic “receivables look high” to something narrower such as “this customer group, under these payment terms and recognition conditions, needs verification.”
Ask for Evidence That Can Defeat the Leading Explanation
Suppose the team’s current leading explanation is that three large customers moved to longer payment terms while the revenue and gross-margin improvement remains economically real. A useful request list should be designed to overturn that explanation if it is wrong.
| Candidate mechanism | Priority evidence | What would support it | What would weaken it |
|---|---|---|---|
| Slower enterprise collection | payment terms, AR ageing, subsequent cash | terms genuinely lengthened and later collections arrive normally | terms unchanged, ageing worsens, cash remains weak |
| Mix / pricing improvement | customer and SKU bridge, realised price, discounts, segment margin | improvement traces to identifiable price or mix drivers | headline margin rises but detailed drivers do not reconcile |
| Large period-end contracts | contract, delivery, acceptance, milestone, returns/credits | delivery and acceptance support the recorded timing | acceptance or performance evidence falls after period end |
| Estimate / classification change | policy memo, reserve roll-forward, GL mapping, disclosure | a documented and consistent change explains the reporting movement | no corresponding change exists or balances disagree |
| Cut-off / recognition risk | invoice, service or shipment log, acceptance, journal timing, subsequent events | evidence supports completion within the period | multiple records point to completion after period end |
| Control / override concern | journal population, approver, user, timing, business purpose | entries are routine, approved and supported | period-end manual entries lack business rationale or documentation |
Different records answer different disputes. Payment terms and subsequent cash test whether the working-capital divergence behaves like a collection issue. Contracts, delivery and acceptance records test whether large period-end transactions were recorded in the period supported by the underlying obligations. Journal populations become relevant when the control or override mechanism is live, because that mechanism predicts unusual users, approvals, timing or business purpose.
Journal-entry testing and unusual-transaction review come from audit practice, so their role here should stay bounded. They can inspire where a management team looks for evidence. Finding an unusual entry does not itself produce a fraud conclusion, and management analysis does not create an audit opinion.
Stop With the Evidence State You Actually Have
A diagnostic can finish with different branches in different states. In the synthetic case, the team could legitimately finish with five different evidence states at the same time:
| Evidence state | What the team can responsibly say |
|---|---|
| Reconciled fact | The 18% revenue increase has passed definition, scope and bridge reconciliation; growth is concentrated in three enterprise customers and product mix. |
| Red flag | Receivables are growing faster than revenue and period-end concentration is materially above historical pattern, so investigation priority should increase. |
| Candidate mechanism | Longer payment terms and a small number of large enterprise contracts can explain part of the receivables and timing pattern. |
| Supported root cause | If contracts, acceptance, subsequent cash, customer-level bridges and ledger evidence align, a shift in customer structure and payment terms can be promoted to the best-supported mechanism for the working-capital divergence. |
| Unresolved | If acceptance timing and period-end journal handling remain inconsistent for one large transaction, that branch should stay unresolved rather than being forced into the broader story. |
That mixed ending is useful. A supported operating mechanism can move to the commercial or finance team for action. A red flag can remain with the diagnostic team. An unresolved control or recognition branch can be escalated to a Controller, Internal Audit, an Audit Committee, Legal or an external auditor. The status tells the next owner what is known and what is still open; it does not determine legal liability or amount to an audit opinion.
The same quarter can therefore contain all five states without contradiction. Revenue growth may be reconciled, receivables growth may remain a red flag, longer payment terms may be the leading candidate mechanism, the working-capital divergence may have a supported root cause, and one large transaction may still be unresolved on cut-off or journal handling.
The practical hand-off is simply to preserve those distinctions. Each important claim should carry the evidence state it has earned, the records that moved it there, and any observation that would cause the team to reopen it.