A 4 million raise sound precise. They still do not tell you how much of the company the founders gave up.
That answer depends on a longer record: the cap-table denominator, convertibles already in the stack, when the option pool is increased, how many shares each priced round creates, and the rights attached to preferred stock. If the company is later sold, a second model enters the picture because ownership and payout priority are not the same calculation.
This worked example keeps those moving parts inside one synthetic company, Northstar Labs. The numbers are illustrative, not market benchmarks, and the example is neither legal nor investment advice. Actual economics depend on the operative SAFE, term sheet, charter, stock purchase agreement and other governing documents.
A percentage is only as stable as its denominator
Northstar starts with 8,000,000 founder/common units and a 2,000,000-unit employee option pool on the stated fully diluted modelling basis.
| Holder / reserve | FD-equivalent units | FD % |
|---|---|---|
| Founders / common | 8,000,000 | 80.0% |
| Employee option pool | 2,000,000 | 20.0% |
| Total | 10,000,000 | 100.0% |
The founders are at 80% because that denominator already includes the reserved pool. On an issued-common-only view they would appear to own more. Add convertibles, warrants, options or other as-converted items and the percentage moves again.
So an ownership figure needs an as-of date, a list of the securities and reserves included, and explicit conversion assumptions for SAFEs, notes, preferred stock, options and warrants. Fully diluted is a modelling convention, not a self-defining denominator.
Northstar will keep that convention throughout. Nothing is reset later to make a new round easier to explain.
From 80% to 56.20% before Series B
The first movement comes from a simplified YC-style post-money SAFE:
- SAFE investment: $1.0M
- Post-money valuation cap: $10.0M
- No discount, MFN or pro-rata exercise in this worked path
- Simplifying assumption: the SAFE represents 10% of the company on the stated modelling basis before the later new-money round
YC’s current standard post-money SAFE is a contract for future equity rather than debt. Under that form it has no interest or maturity date and converts into preferred stock in an equity financing. That description is form-specific and should not be generalised to every instrument called a SAFE in every jurisdiction.
For the valuation-cap example here:
10M = 10%
Representing that 10% against the existing 10,000,000 FD-equivalent units requires roughly 1,111,111 SAFE-equivalent units in the model.
| Holder / reserve | Units | FD % after SAFE |
|---|---|---|
| Founders | 8,000,000 | 72.0% |
| Option pool | 2,000,000 | 18.0% |
| SAFE | 1,111,111 | 10.0% |
| Total | 11,111,111 | 100.0% |
The founders are now at 72%, before any Series A shares exist.
A convertible note would leave a different constraint set because it is debt, normally accrues interest and has a maturity date. Its conversion can depend on principal, accrued interest where applicable, a valuation cap or discount and the relevant financing trigger. A priced preferred round establishes the current share price and preferred rights directly. NVCA’s model legal documents show a typical US financing architecture across the Certificate of Incorporation, Stock Purchase Agreement, Investors’ Rights Agreement, Voting Agreement and Right of First Refusal and Co-Sale Agreement. Those are model documents, not automatically operative terms for Northstar or any other company.
The next change occurs before the priced round closes. The Series A investor asks Northstar to increase the option pool to 20% of the pre-money fully diluted denominator. The company already has 2,000,000 pool units; reaching that target after the SAFE requires roughly 277,778 additional units, for a reserve of about 2,277,778 units.
| Holder / reserve | Pre-Series-A FD % |
|---|---|
| Founders | 70.24% |
| Refreshed option pool | 20.00% |
| SAFE | 9.76% |
| Total | 100.00% |
The founders have moved again, from 72.00% to about 70.24%, without receiving any Series A cash. The pre-money denominator expanded first.
Carta’s option-pool guidance separates this pre-money treatment from a post-money pool increase. If the increase is included in pre-money shares, the holders already present before closing bear the dilution. If the pool is enlarged after the financing, the new investor can share it. The operative term sheet decides which treatment applies.
Now price Series A:
- Pre-money valuation: $16M
- New money: $4M
- Post-money valuation: $20M
- Series A ownership in this simplified model: 20% post-money
The refreshed pre-money FD denominator is about 11,388,889 units. That implies roughly $1.4049 per unit and about 2,847,222 new Series A units.
| Holder / reserve | Post-Series-A FD % |
|---|---|
| Founders | 56.20% |
| Option pool | 16.00% |
| SAFE-converted security | 7.80% |
| Series A | 20.00% |
| Total | 100.00% |
The headline is still 4 million of new money. It does not record who absorbed the pool increase.
The same priced round with the pool moved to the other side of closing
Keep 4M new money, but refresh the pool after the financing and target 16% of the post-refresh cap table. The bounded counterfactual is:
| Holder / reserve | Pre-money refresh | Post-money refresh |
|---|---|---|
| Founders | 56.20% | 56.52% |
| Option pool | 16.00% | 16.00% |
| SAFE | 7.80% | 7.85% |
| Series A | 20.00% | 19.63% |
The valuation headline survives unchanged while the incidence of dilution moves between existing holders and the incoming investor.
Series B compounds everything already on the table
Northstar later raises:
- Pre-money valuation: $32M
- New money: $8M
- Post-money valuation: $40M
- Series B: 20% post-money
Series B buys into the post-Series-A cap table. The founders are not reset to 100%, and the SAFE, pool and Series A do not disappear from the denominator.
| Holder / reserve | Post-Series-B FD % |
|---|---|
| Founders | 44.96% |
| Employee option pool | 12.80% |
| SAFE-converted security | 6.24% |
| Series A | 16.00% |
| Series B | 20.00% |
| Total | 100.00% |
Seen as one bridge:
| Event | Founder FD ownership |
|---|---|
| Starting cap table | 80.00% |
| After SAFE | 72.00% |
| After pre-money pool refresh | 70.24% |
| After Series A | 56.20% |
| After Series B | 44.96% |
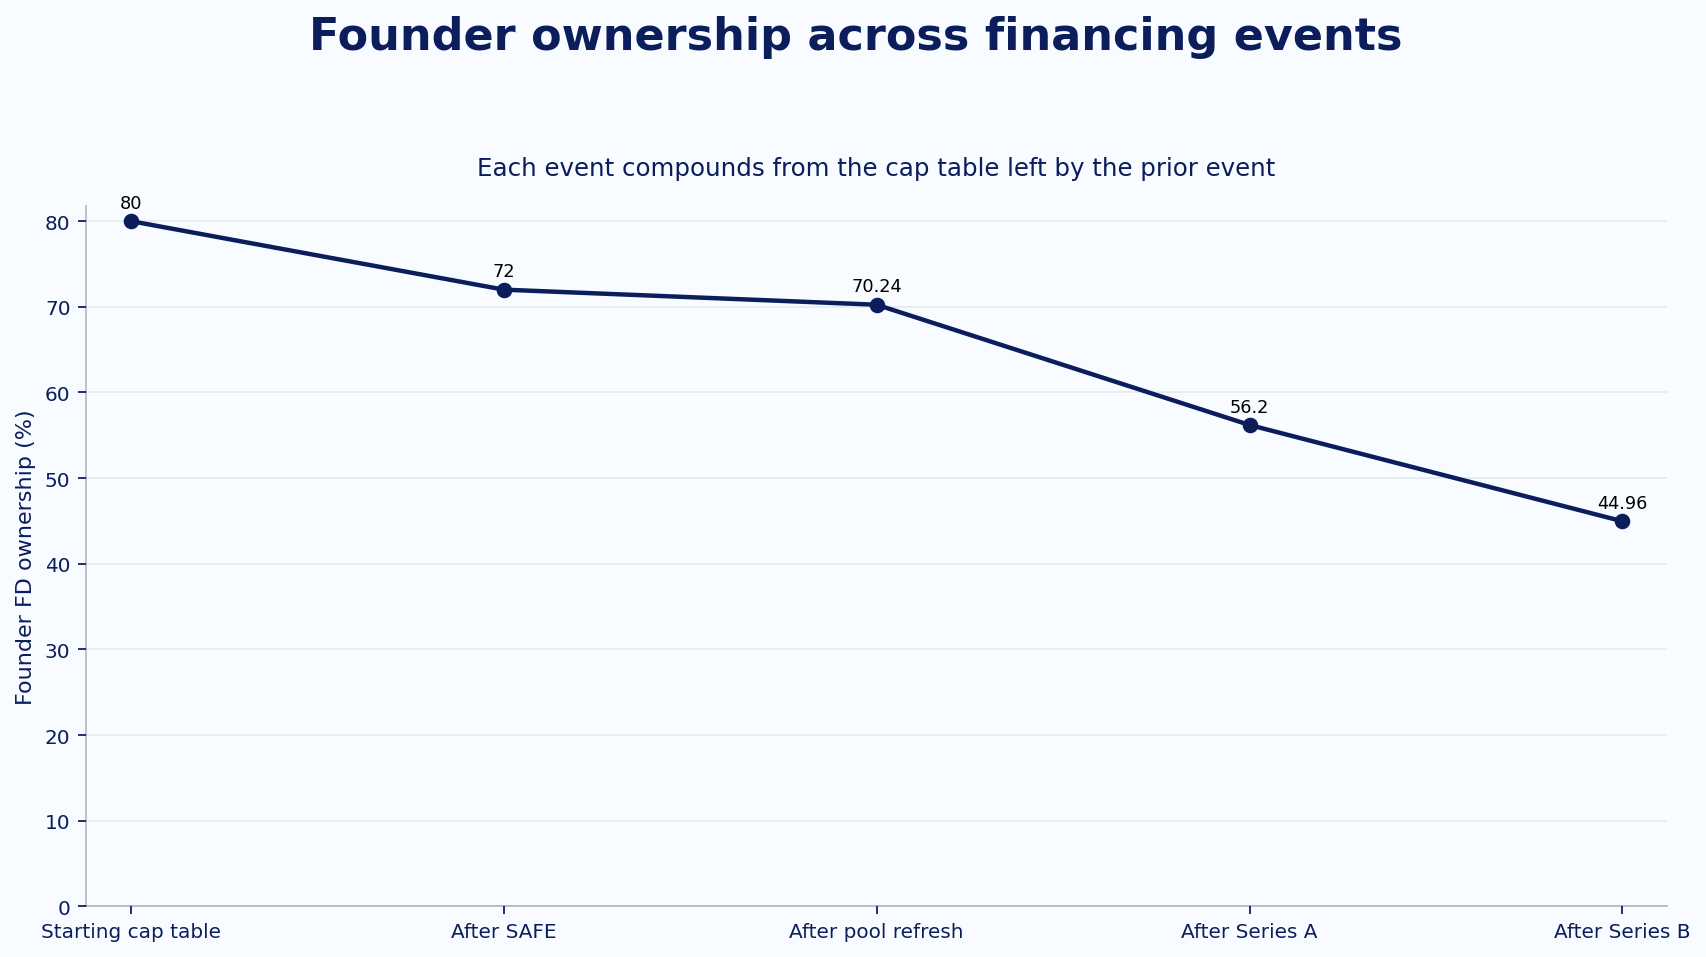
Each dilution step compounds from the cap table left by the prior event.
Sequential dilution is just that record carried forward. SAFE conversion, pool changes and new issuances compound because every later event acts on the cap table produced by the earlier ones.
At exit, change models
The founders now show 44.96% on the stated fully diluted basis. Leave that cap table alone. The next question is how a given amount of equity proceeds is distributed.
Preferred rights can change that payout order. For a Delaware corporation, DGCL §151 provides a statutory framework under which classes or series can carry different preferences, rights and limitations when those terms are set out in the certificate of incorporation or an authorised resolution. That is a Delaware-specific legal example. The operative financing documents govern the actual rights.
For this worked case, we need liquidation preference, the conversion choice for non-participating preferred, and seniority between series. Northstar uses a deliberately synthetic stack, not a market standard:
- Series B: 1x non-participating preferred, senior, with an $8M preference
- Series A: 1x non-participating preferred, with a $4M preference
- The SAFE has already converted into a preferred security; in this example it receives a $1M preference and ranks pari passu with Series A
- A merely reserved, ungranted pool would not receive sale proceeds; here, assume the 12.8% pool shown at exit has by then become granted/exercised employee common
- Each exit value below is equity proceeds available to shareholders, not enterprise value
If the starting point were enterprise value, debt, cash, transaction costs and other closing adjustments could sit between that number and the value available to shareholders. A SAFE that remained outstanding at the liquidity event would also need to be modelled under its actual liquidity-event provisions rather than the converted-preferred assumption used here.
One cap table, three payout results
$15M of equity proceeds
Series B’s 20% as-converted value would be 8M preference**. Series A takes 1M.
4M + 13M
The remaining $2M goes to common under the stated employee-common assumption.
| Holder | Proceeds at $15M exit |
|---|---|
| Founders | about $1.56M |
| Employee common | about $0.44M |
| SAFE preferred | $1.00M |
| Series A | $4.00M |
| Series B | $8.00M |
| Total | $15.00M |
That is about $1.56M for founders who still show 44.96% FD ownership, roughly 10.4% of the equity proceeds.
$30M of equity proceeds
Series B’s 20% as-converted value is 8M preference** still wins. After that payment, **4M and $1M preferences.
| Holder | Proceeds at $30M exit |
|---|---|
| Founders | about $12.36M |
| Employee common | about $3.52M |
| SAFE converted | about $1.72M |
| Series A | about $4.40M |
| Series B | $8.00M |
| Total | $30.00M |
Series B takes the preference; Series A and the SAFE convert.
$100M of equity proceeds
At 20M, comfortably above its $8M preference. Series A and the SAFE are also better off converting.
| Holder | Proceeds at $100M exit |
|---|---|
| Founders | about $44.96M |
| Employee common | about $12.80M |
| SAFE converted | about $6.24M |
| Series A | about $16.00M |
| Series B | about $20.00M |
| Total | $100.00M |
Across the three exits, the ownership column never changes:
| Equity proceeds | Founder FD ownership | Founder proceeds | Waterfall mode |
|---|---|---|---|
| $15M | 44.96% | about $1.56M | Preference-dominant |
| $30M | 44.96% | about $12.36M | B takes preference; A / SAFE convert |
| $100M | 44.96% | about $44.96M | All convert |
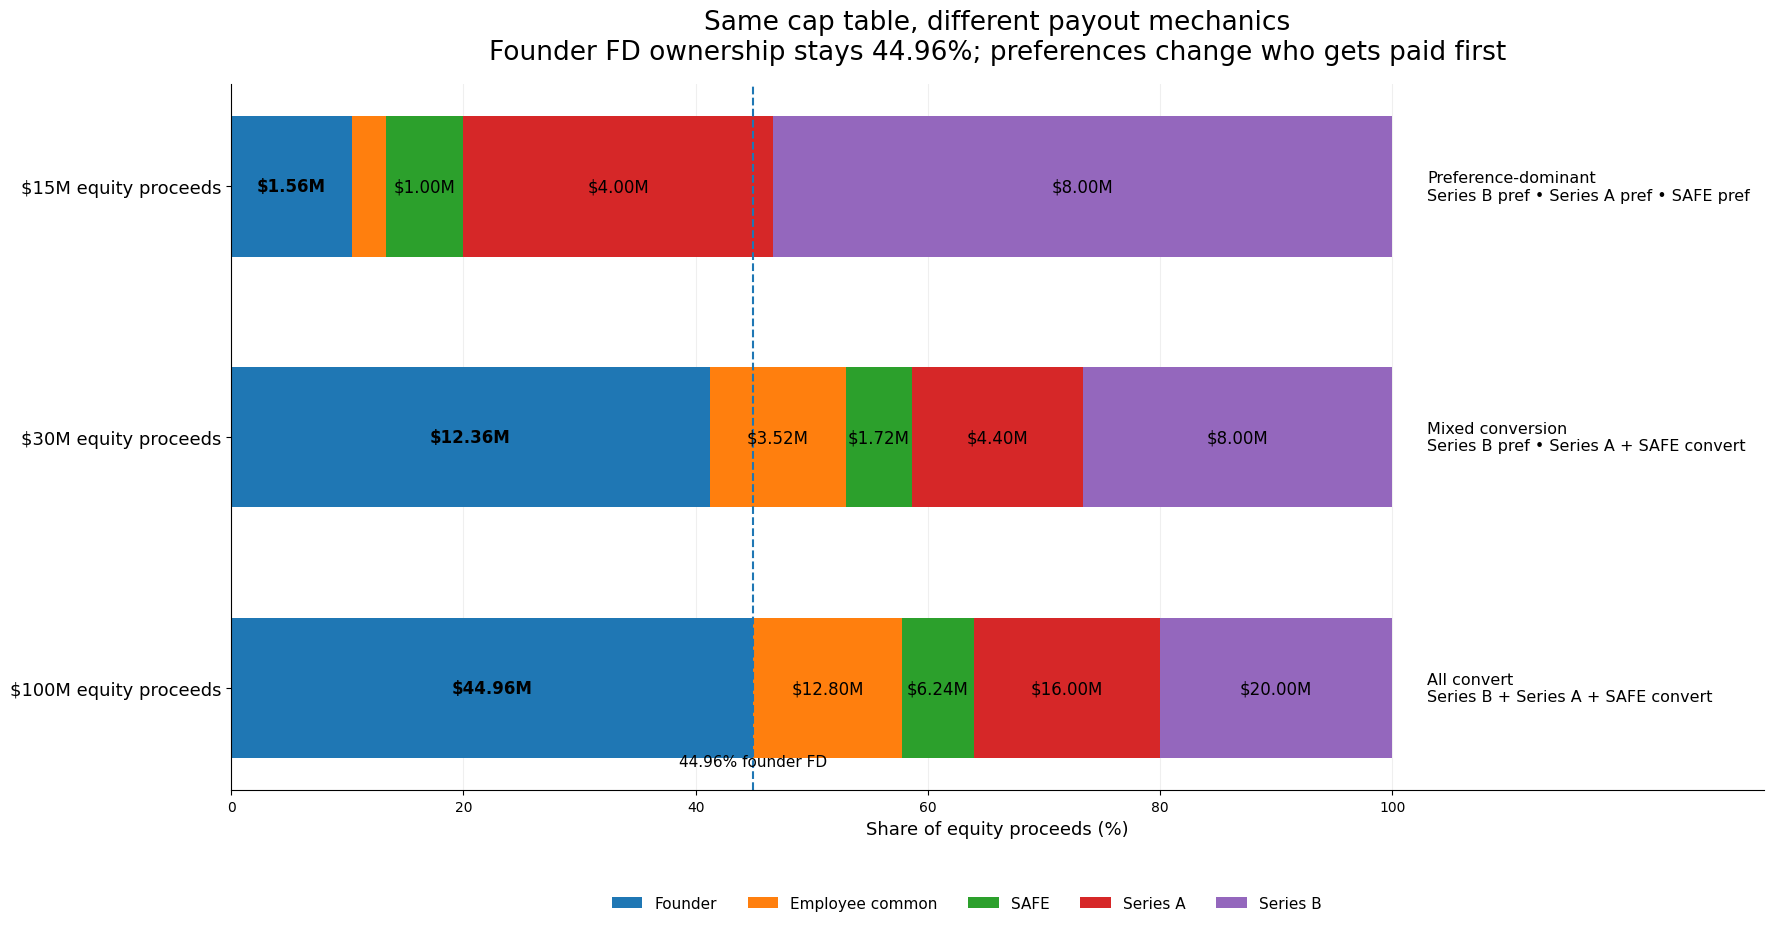
The same cap table does not imply the same payout mix at every exit; binding liquidation preferences can pull realized proceeds away from fully diluted ownership.
The founders still own 44.96% on the stated FD basis in all three scenarios, but their proceeds range from about 44.96M because the available equity value and the preferred-rights choices change the waterfall.
Keep the questions with the cap table
Northstar’s founders move from 80.00% to 72.00%, then 70.24%, 56.20% and finally 44.96%. Each figure can be traced to a specific financing event, so keeping the intermediate cap tables makes the later percentage reproducible.
When reviewing a SAFE, term sheet or financing, keep these checks beside the model:
- What is the cap table’s exact as-of date?
- Which securities, options, reserved pool and convertibles are in the denominator?
- What converts, when does it convert, and under which formula?
- Is the option-pool top-up pre-money or post-money?
- How many new shares are created, and what preferred rights come with them?
- Which cap table becomes the starting point for the next round?
- What do the liquidation preference, conversion choice and seniority provisions actually say?
- Is the exit model using enterprise value or equity proceeds available to shareholders?
If those answers are recorded, the economics can be recalculated from the pre-financing cap table through to the exit waterfall. That is the record needed to answer how much of the company was actually sold.
References
- Y Combinator, The SAFE — the open standard for startup fundraising
- Y Combinator, SAFE vs. convertible note vs. priced round
- Y Combinator, SAFE conversion calculator
- National Venture Capital Association, Model Legal Documents
- Delaware Code Online, Title 8, §151 — Classes and series of stock; redemption; rights
- Carta, What is an option pool? A guide for startup founders